Table of Contents
Metrica Software has added two new reporting capabilities to Power BI Connector for Salesforce. Teams can now export Salesforce reports to Power BI by creating Power BI data sources directly from Salesforce reports, including joined reports. They can also embed Power BI reports inside Salesforce dashboards and manage those dashboards from the connector.
This update is useful for teams that already work across both platforms. Salesforce is often where business users define operational reporting logic, such as pipeline views, sales performance reports, account activity, service reporting, or revenue tracking. Power BI is where teams build deeper analytics, combine data from multiple systems, and create reports for broader decision-making.
The new capabilities help connect these two parts of the reporting process. Teams can start from Salesforce reports they already use, turn them into Power BI data sources, build Power BI reports, and bring selected reports back into Salesforce for daily visibility.
Export Salesforce Reports to Power BI with Power BI Connector for Salesforce
Salesforce reports often contain more than a simple list of fields. They reflect how teams already think about the business. A report may include the right objects, selected fields, filters, report type, folder context, ownership, and a structure that users already trust.
Before this update, moving from a Salesforce report to Power BI usually meant rebuilding that setup manually. Teams had to identify the right objects, select fields again, recreate filtering logic, and validate that the Power BI data source matched the business view users expected.
With the new Reports capability, Power BI Connector for Salesforce gives teams a faster starting point. A Salesforce report can now become the basis for a Power BI data source.
Create Power BI Data Sources from Salesforce Reports
The new Reports section in Power BI Connector for Salesforce lists Salesforce reports available to the current user. From this section, users can browse reports and create a Power BI data source from a selected report.
This makes the reporting workflow more practical when a Salesforce report already represents a trusted business view. For example, a sales operations team may already use reports for open pipeline, closed revenue, activities, forecast review, or regional performance. A finance or leadership team may already rely on Salesforce reports for recurring business reviews.
Instead of starting from an empty data source, users can begin with the Salesforce report that already contains the relevant reporting structure.
This is important because “export Salesforce reports to Power BI” does not mean downloading a static file and uploading it elsewhere. The connector uses the Salesforce report as the starting point for a Power BI data source that can be managed inside Power BI Connector for Salesforce and used in Power BI.
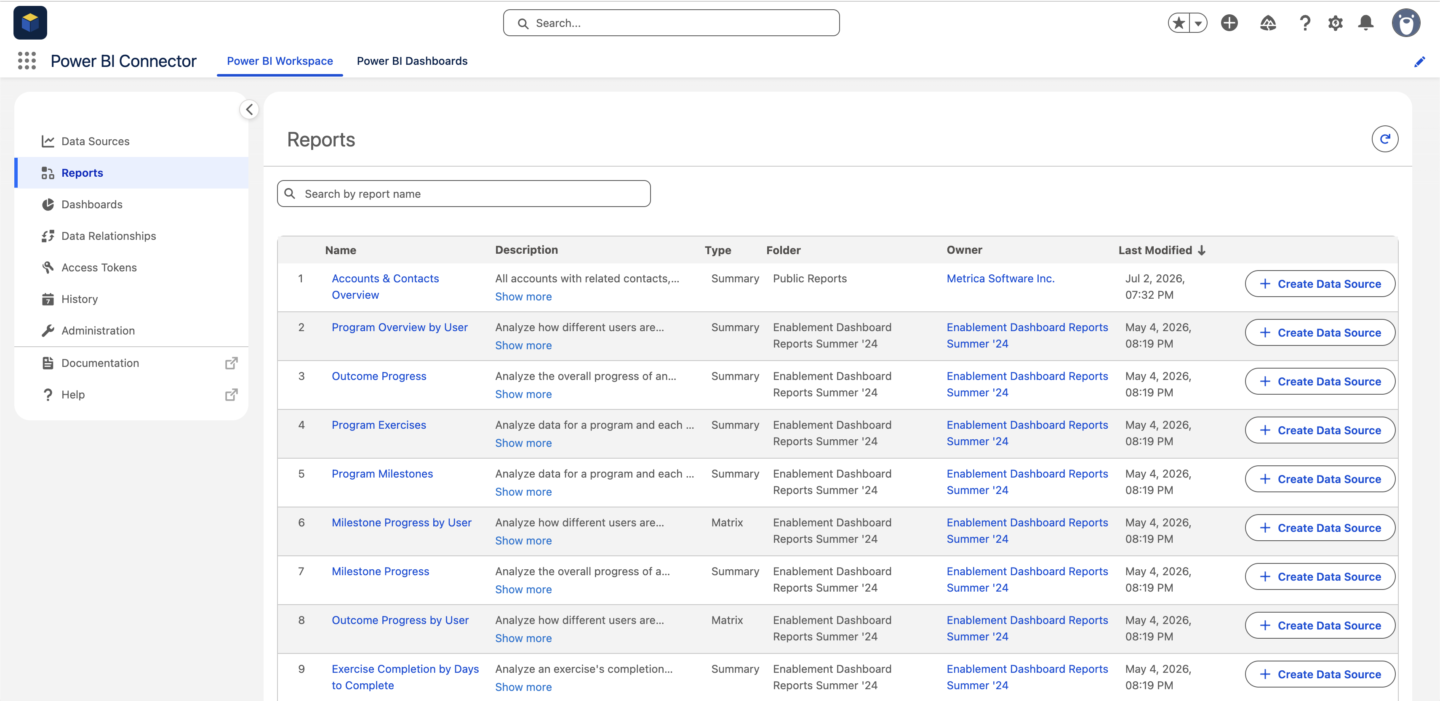
Steps: How to Export Salesforce Reports to Power BI in Minutes
The flow is designed to be simple, but it still gives users control before the data source is saved.
Step 1: Choose a Salesforce report
The user opens the Reports section inside Power BI Connector for Salesforce and selects a report available to them.
The report list includes key details such as report name, report type, folder, owner, and last modified date. This helps users choose the right report, especially in Salesforce environments with many reports across teams and folders.
Step 2: Create a data source from the report
After choosing a report, the user clicks Create Data Source. The connector opens the data source editor and prepopulates it with details from the selected Salesforce report.
This gives the user a ready starting point instead of requiring them to build the data source from the beginning.
Step 3: Review objects, fields, and filters
The user reviews the generated data source setup before saving. The editor includes report details, objects, and fields. Users can adjust the configuration if needed, including fields or filters, before the data source is saved.
This step matters because the report provides the starting point, but Power BI teams may still need to refine the data source for a specific dataset, report model, or refresh strategy.
Step 4: Save the data source and connect it to Power BI
Once the data source is saved, it becomes available inside Power BI Connector for Salesforce. Users can then connect it to Power BI and continue building reports, models, and dashboards.
Supported Report Types: Export Tabular, Summary, Matrix, and Joined Reports to Power BI
Power BI Connector for Salesforce supports all Salesforce report types for this flow:
- Tabular reports
- Summary reports
- Matrix reports
- Joined reports
Joined reports are especially important because they are often used for more complex Salesforce reporting. A joined report can combine multiple report blocks and help teams compare related business views in one report.
For teams that already use joined reports in Salesforce, this support reduces the need to recreate complex report structures from the beginning. Users can start from a joined report and continue the analysis in Power BI with less manual preparation.
Salesforce Report-Based Data Source Management in Power BI Connector for Salesforce
After a data source is created from a Salesforce report, it works like other data sources in Power BI Connector for Salesforce.
Users can continue managing the data source inside the connector. They can edit the configuration, preview data, view the entity relationship diagram, share the data source, and use it in Power BI.
This is important because a report-based data source should not be a one-time export with no flexibility after creation. Teams still need to validate, adjust, and manage data sources as reporting requirements change.
For detailed setup instructions, read the documentation: How to Export Salesforce Reports and Joined Reports to Power BI
Embed Power BI Reports in Salesforce with Power BI Connector for Salesforce
The second new capability brings Power BI reports back into Salesforce.
Many teams use Power BI as their main analytics layer, but Salesforce remains the daily workspace for sales, revenue, customer, and operations teams. This creates a practical gap. Reports are built in Power BI, but the people who need to use them often spend most of their day in Salesforce.
With the new Power BI Dashboards capability, teams can create dashboards inside Power BI Connector for Salesforce and add Power BI reports as embedded widgets.
This helps Salesforce users access Power BI reporting from the same environment where they already manage accounts, opportunities, customer activity, and operational work.
Create Salesforce Dashboards with Embedded Power BI Reports
The new Power BI Dashboards section allows users to create and manage dashboards inside the connector.
A dashboard can include one or more Power BI reports. Each report is added as a dashboard widget. This makes it possible to build dashboard pages for different teams, roles, or reporting needs.
For example, a sales operations team can create a dashboard for pipeline analysis and forecast review. A customer team can create a dashboard for account health, renewals, or support performance. Leadership can use dashboards to view Power BI reporting that combines Salesforce data with financial, marketing, product, or operational data from other systems.
The dashboard is managed inside Salesforce, while the report content remains controlled by Power BI.
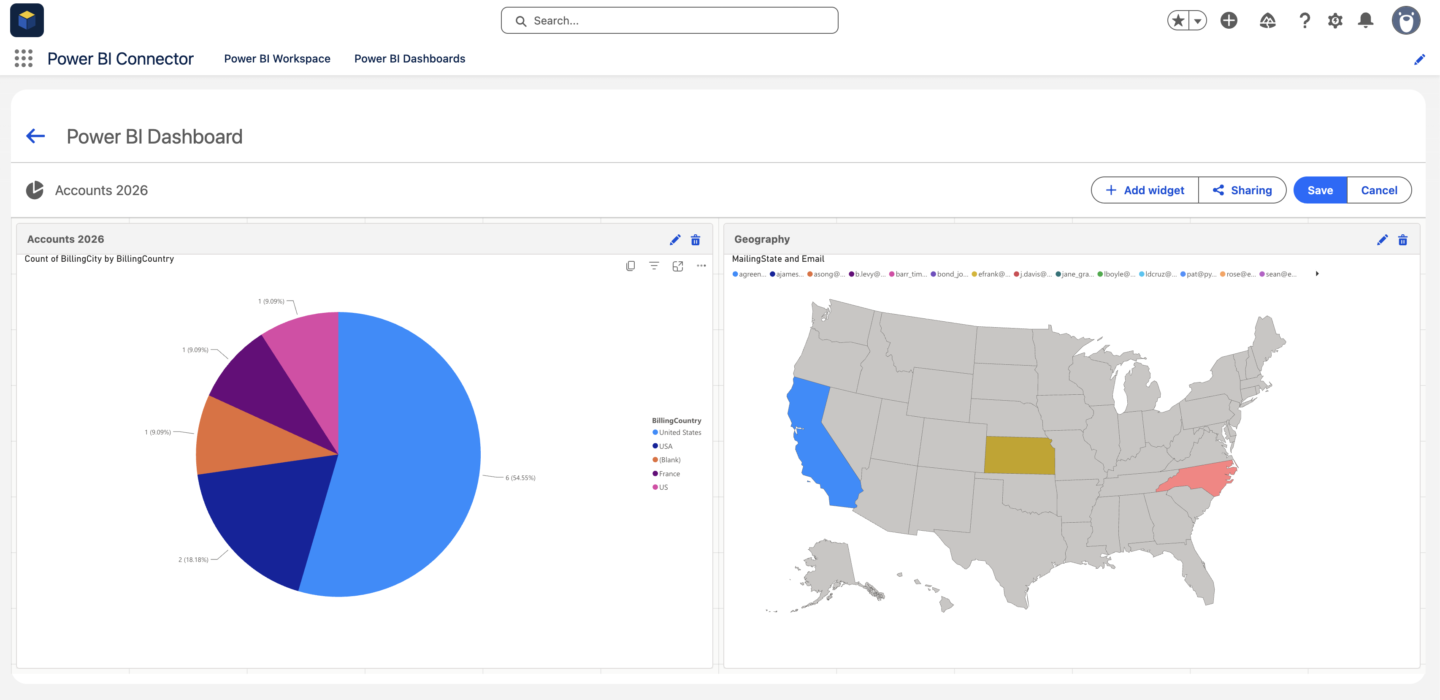
Steps: How to Embed a Power BI Report in Salesforce
The dashboard flow helps users add Power BI reports to Salesforce without turning the process into a custom development project.
Step 1: Create a dashboard
The user opens the Power BI Dashboards section and creates a new dashboard. The dashboard opens as an empty workspace that can be edited.
Step 2: Add a Power BI report widget
The user clicks Add widget and enters the widget title. The title becomes the widget header shown on the dashboard.
Step 3: Paste a secure Power BI embed URL
The user copies a secure embed URL from Power BI and adds it to the widget settings. This URL is used to render the Power BI report inside Salesforce.
The connector is designed for secure Power BI embed URLs, not public “Publish to web” links.
Step 4: Configure display options
The user can configure display options such as filters, navigation, and action bar visibility. This gives teams more control over how the embedded Power BI report appears inside the dashboard.
Step 5: Arrange, resize, and save the dashboard
Widgets can be arranged on a grid, resized, and saved as part of the dashboard layout. Teams can build simple dashboards with one embedded report or broader dashboards with several Power BI report widgets.
Supported Power BI Report Sources: Embed Power BI Reports Built on Salesforce Data or Other Systems
The embedded Power BI report can be built on Salesforce data exported through Power BI Connector for Salesforce. This creates a complete reporting loop: users export Salesforce data to Power BI, build reports in Power BI, and bring selected reports back into Salesforce.
The feature is not limited to Power BI reports built only on Salesforce data. Teams can also embed Power BI reports based on data from other systems.
This matters for companies where Salesforce users need more than Salesforce-only reporting. A dashboard inside Salesforce can show Power BI reports that combine pipeline data, finance data, marketing performance, product usage, service metrics, or other operational sources.
Salesforce becomes the workspace where users can view broader business reporting, while Power BI remains the place where reports are built, modeled, and governed.
Power BI Authorization for Embedded Reports: How Access to Embedded Reports Works
Embedded Power BI reports inside Salesforce are not public reports.
Users can view a Power BI report inside Salesforce only if they already have permission to view that report in Power BI. They must also be signed in to Power BI in the same browser.
This is important for teams that want easier access to reporting without weakening report permissions. The dashboard makes the report easier to reach from Salesforce, but Power BI still controls access to the report content.
The connector uses secure Power BI embed URLs. Public “Publish to web” links should not be used for controlled business reporting because they are not designed for the same access model.
Share Dashboards with Salesforce Users and Groups
Dashboards with embedded Power BI reports can be shared with Salesforce users and groups from inside the connector.
This gives teams control over who can open each dashboard in Salesforce. For example, a regional sales dashboard can be shared with sales managers, while an executive reporting dashboard can be limited to selected leadership users.
This creates two layers of access control. Salesforce dashboard sharing controls access to the dashboard inside Power BI Connector for Salesforce. Power BI authorization controls whether the embedded report content can be viewed.
That distinction is important. A user may have access to a dashboard in Salesforce, but still needs the right Power BI permissions to see the embedded report.
Use Dashboard History to See What Changed
Dashboard activity is tracked in the Dashboards history tab.
Teams can see who created or updated dashboards, when changes happened, and what was modified. This gives admins and managers more visibility when dashboards are shared, edited, and used over time.
History is especially useful when dashboards become part of recurring business reporting. If a dashboard layout changes, a widget is updated, or sharing is modified, teams have a clearer record of that activity.
For detailed setup instructions, read the documentation: How to Create and Manage Power BI Dashboards
Try Power BI Connector for Salesforce
Power BI Connector for Salesforce now supports a more complete Salesforce to Power BI reporting flow.
Teams can start from Salesforce reports, create Power BI data sources faster, build reports in Power BI, and embed selected Power BI reports back into Salesforce dashboards. This helps reduce manual setup, gives BI teams a clearer path from Salesforce reporting to Power BI analysis, and brings Power BI insights closer to Salesforce users.
With the latest update, teams can:
- Export existing Salesforce reports to Power BI
- Create Power BI data sources from joined reports
- Embed Power BI reports inside Salesforce
- Share dashboards with embedded Power BI reports with Salesforce users and groups
- Track dashboard changes in Dashboards history
If your team uses Salesforce for daily work and Power BI for analytics, Power BI Connector for Salesforce gives you a more direct way to connect both environments.
Ready to try it?
Install or explore Power BI Connector for Salesforce on Salesforce AgentExchange.
Want to see the full setup before installing?
Read the step-by-step guide: Connect Salesforce to Power BI with Power BI Connector for Salesforce.
Need technical setup details?
Browse the Power BI Connector for Salesforce documentation.
Want to discuss your Salesforce to Power BI reporting workflow?
Book a demo or contact Metrica Software support team.