Every number on a Power BI dashboard or Tableau report started somewhere else. It started as a purchase order in SAP, a closed deal in Salesforce, a transaction in a payments system, or a row in a spreadsheet someone uploaded to SharePoint. A data pipeline is the automated system that moves that information from where it lives to where it can be analyzed.
If you have ever wondered why your finance dashboard updates overnight instead of in real time, or why the sales numbers in your BI tool do not match what you see in Salesforce, the answer almost always involves the pipeline sitting between those systems. Understanding how that pipeline works, even at a high level, makes it far easier to ask the right questions when something breaks or when a report does not look right.
How a Data Pipeline Works: Four Stages from Source to Dashboard
A data pipeline follows a consistent pattern regardless of the tools involved. Data moves through four stages, each with a specific job.
Extract is the starting point. The pipeline connects to source systems (your ERP, CRM, databases, cloud applications, or flat files) and pulls data out. Extraction can grab everything at once or pull only records that changed since the last run. Most enterprise pipelines use incremental extraction to avoid hammering source systems with full data pulls every time.
Transform is where raw data gets cleaned and reshaped. Source systems store data in their own formats with their own codes and conventions. SAP stores dates as eight-digit integers. Salesforce uses its own picklist values. Financial systems record currency amounts with different decimal precision. Transformation standardizes all of that: removing duplicates, fixing inconsistencies, converting data types, applying business rules, and joining records from different sources into a unified view.
Load moves the processed data into its destination, typically a data warehouse or lakehouse. Loading can happen as a bulk operation (replace everything) or incrementally (add only what changed). Most organizations schedule loads during off-peak hours to avoid competing with users who are running reports during the business day.
Serve makes the finished data available to the tools people actually use: Power BI dashboards, Excel reports, Tableau visualizations, or downstream applications. This stage often involves building a semantic model, a business-friendly layer that defines measures, relationships, and hierarchies so that report consumers do not need to write SQL or understand the underlying table structure.
A concrete example ties this together. A manufacturing company runs SAP S/4HANA for finance and operations. Each night, the pipeline extracts purchase orders and general ledger entries from SAP, transforms them by converting SAP-specific data formats and joining purchase data with vendor master records, loads the result into a cloud data warehouse as clean fact and dimension tables, and serves the output through Power BI dashboards that the finance team opens every morning.
ETL: Transform First, Then Load into the Warehouse
ETL stands for Extract, Transform, Load, and the order of those words matters. In an ETL pipeline, data is pulled from source systems, transformed in a separate processing environment (often called a staging area), and only the cleaned, validated result is loaded into the data warehouse.
How ETL Processing Works
The key characteristic of ETL is that transformation happens outside the warehouse. A dedicated ETL engine or server sits between the sources and the destination. It receives raw data, applies all cleaning and business logic, and passes only the curated output to the warehouse. In many organizations, this means the warehouse only ever contains polished, validated data.
ETL tools like Informatica PowerCenter, SQL Server Integration Services (SSIS), and SAP Data Services have been the backbone of enterprise data integration for decades. These platforms provide visual design interfaces where developers build transformation logic as dataflows, mapping source fields to target fields with cleaning rules, lookups, and aggregations along the way.
When ETL Is the Right Fit for Enterprise Data
ETL tends to be the stronger choice in regulated industries where data must be cleaned, masked, or validated before it ever reaches the warehouse. Healthcare organizations handling patient records, financial institutions subject to SOX compliance, and government agencies with strict data handling requirements often prefer ETL because it guarantees that sensitive data is processed and scrubbed before storage.
Legacy on-premises environments also favor ETL. If the target database does not have the processing power to run heavy transformations internally, doing that work in a dedicated engine before loading makes practical sense. Organizations running older versions of SQL Server or Oracle as their analytics destination often fall into this category.
The trade-off is rigidity. Because transformation logic is defined before loading, changing a business rule or adding a new calculation means modifying the ETL pipeline, retesting, and redeploying. That cycle can take days or weeks depending on the organization’s change management process.
ELT: Load Raw Data First, Transform Inside the Warehouse
ELT flips the middle two steps. Data is extracted from sources and loaded directly into the warehouse or lakehouse in its raw form. Transformation happens afterward, inside the destination system, using that system’s own processing power.
This approach became practical with the rise of cloud data warehouses like Snowflake, Google BigQuery, Amazon Redshift, and Microsoft Fabric. These platforms separate storage from compute and can scale processing power on demand. That means the warehouse itself is powerful enough to handle the heavy transformation work that previously required a separate ETL server.
How ELT Changes the Workflow
In an ELT pipeline, raw data lands in the warehouse first. A Salesforce extract arrives as-is: every field, every picklist value, every custom object, in Salesforce’s native format. The same goes for SAP data, marketing platform data, or anything else the pipeline touches.
Transformation then runs inside the warehouse using SQL. Tools like dbt (data build tool) have become the standard for this step. dbt lets analysts who know SQL build production-grade transformation pipelines without needing specialized ETL development skills. They write SQL models that clean, join, and reshape the raw data into analytics-ready tables, and dbt handles the dependency management, testing, and documentation.
The practical advantage is flexibility. Because the raw data is always preserved in the warehouse, teams can re-transform it as business requirements evolve. If the CFO asks for a new revenue breakdown that requires a different way of categorizing transactions, the data team can write a new dbt model against the raw data without re-extracting anything from the source system.
Managed ELT Tools: Fivetran and Airbyte
The extraction and loading portion of ELT is increasingly handled by managed platforms. Fivetran offers over 700 pre-built connectors that automatically sync data from SaaS applications, databases, and ERPs into a warehouse. Airbyte provides a similar capability with an open-source core and over 300 connectors. Both platforms handle the tedious work of API rate limits, schema changes, and incremental syncs so that data teams can focus on the transformation layer.
ETL vs. ELT: A Side-by-Side Comparison for Business Stakeholders
The difference between ETL and ELT sounds technical, but it has real consequences for how quickly your team can get new data into reports, how much flexibility analysts have, and what your infrastructure costs look like.
In an ETL pipeline, only clean data reaches the warehouse. That means less storage cost for raw data, tighter control over what gets in, and a well-governed environment. But it also means that every new data request requires pipeline changes. If the marketing team needs a Salesforce field that was not included in the original extract, someone has to modify the ETL job, test it, and redeploy it.
In an ELT pipeline, everything lands in the warehouse and analysts can work with whatever is available. New questions do not require pipeline changes because the raw data is already there. The cost shifts from pipeline development time to warehouse compute and storage. Cloud warehouses charge for the processing power used during transformation, so poorly optimized SQL models can drive up costs.
Here is how the two approaches compare across the dimensions that matter most to business stakeholders:
**What reaches the warehouse**
ETL: Clean, transformed data only, ELT: Raw data first, then transformed
**Speed to new insights**
ETL: Slower (pipeline changes needed), ELT: Faster (raw data already available)
**Analyst independence**
ETL: Low (depends on ETL developers), ELT: Higher (analysts can build dbt models)
**Data governance**
ETL: Tighter (data validated before storage), ELT: Requires discipline (raw data needs access controls)
**Infrastructure cost**
ETL: Predictable (dedicated servers), ELT: Variable (cloud compute usage)
**Best environment**
ETL: On-premises, regulated industries, ELT: Cloud-native, modern analytics stacks
Many enterprises run both patterns. Financial data subject to compliance rules goes through ETL with strict validation before loading. Product usage data and marketing analytics follow an ELT path for speed and flexibility. The choice is not either/or at the organizational level.
For a deeper look at how ETL compares with broader data integration approaches, see ETL vs. Data Integration: What Works for Enterprise Analytics.
Batch Processing vs. Streaming: How Often Data Moves
Pipelines do not just differ in where transformation happens. They also differ in when data moves.
Batch processing is the most common approach in enterprise analytics. The pipeline runs on a schedule (every hour, every night, every Sunday) and processes data in chunks. Your daily sales dashboard that refreshes at 6 AM uses a batch pipeline. So does the monthly financial close report that pulls data from SAP after period-end processing completes.
Streaming pipelines process data continuously as it arrives. A fraud detection system that evaluates credit card transactions in real time uses a streaming pipeline. So does a logistics dashboard that tracks shipment locations as they update.
Most organizations do not need to choose one or the other. The standard enterprise pattern uses batch for analytics and reporting (where data that is a few hours old is perfectly acceptable) and streaming for operational use cases where delays cost money or create risk. A retail company might batch-process its sales data for weekly business reviews while streaming point-of-sale data for real-time inventory management.
The cost difference is significant. Batch pipelines run on a schedule and consume compute resources only during their execution window. Streaming pipelines require continuous compute capacity, and the infrastructure to handle failures, out-of-order events, and backpressure adds complexity. Unless the business case specifically demands sub-minute data freshness, batch processing is the pragmatic default.
Real-World Pipeline Examples: SAP and Salesforce Data Flowing to Power BI
Abstract descriptions of pipelines make more sense with concrete scenarios. Here are two common patterns that enterprise organizations run every day.
SAP Financial Data to a Power BI Finance Dashboard
A company runs SAP S/4HANA as its core ERP. The finance team needs consolidated financial dashboards in Power BI that combine general ledger data, accounts payable, and cost center reporting.
The pipeline starts with extraction. Azure Data Factory connects to SAP using its native SAP Table connector through a self-hosted Integration Runtime (a gateway installed on a server that can reach the on-premises SAP system). It pulls data from key SAP tables: BKPF and BSEG for financial postings, CSKS for cost centers, LFA1 for vendor master data. Extraction runs incrementally each night, pulling only documents posted since the last run.
Raw data lands in Azure Data Lake Storage as Parquet files. From there, transformation logic (running in Fabric or through dbt models) converts SAP-specific formats: packed decimal amounts become standard numeric fields, SAP date integers become proper date types, company code and cost center hierarchies get flattened into dimension tables that make sense outside of SAP.
The transformed data loads into a Fabric Data Warehouse as a star schema with fact tables for financial postings and dimension tables for cost centers, vendors, and company codes. Power BI connects to that warehouse and presents the data through a semantic model with business-friendly measure names like “Total AP Outstanding” and “Budget vs. Actual by Cost Center.”
Metrica’s Power BI Connector for SAP provides an alternative path for organizations that want to connect Power BI to SAP data without building a full warehouse pipeline, handling the extraction and data mapping in a single step.
Salesforce Opportunity Data Combined with ERP Revenue for Pipeline Analysis
A B2B company uses Salesforce as its CRM and needs to reconcile the sales pipeline in Salesforce with actual booked revenue in the ERP. The sales team sees opportunities in Salesforce, but finance tracks recognized revenue in SAP. Bringing those two views together requires a pipeline that spans both systems.
Fivetran extracts data from Salesforce (Accounts, Opportunities, Contacts, and custom objects) and loads it into a Snowflake data warehouse in raw form. A separate pipeline extracts revenue data from SAP through Azure Data Factory. Both datasets land in the same warehouse.
dbt models then join the Salesforce opportunity data with SAP revenue records, matching on shared identifiers like customer account numbers. The output is a unified pipeline-to-revenue table that shows, for each customer, the Salesforce pipeline value alongside the actual invoiced and recognized revenue from SAP.
Power BI reads from the curated layer and presents a dashboard where sales leadership can see pipeline conversion rates, forecast accuracy, and revenue gaps without switching between systems or manually reconciling spreadsheets.
The differences between warehouses, lakes, and lakehouses as pipeline destinations are explained in Data Warehouse vs. Data Lake vs. Lakehouse: Key Differences.
Common Data Pipeline Problems Business Users Should Know About
Pipelines break. Understanding the most common failure points helps business users diagnose issues faster and ask better questions when data looks wrong.
Schema drift is one of the most frequent causes of pipeline failures. It happens when a source system changes its data structure without warning. Someone adds a new field to a Salesforce object, renames a column in a database, or changes a data type. The pipeline was built to expect a specific schema, and when that schema changes, the pipeline either fails outright or loads incorrect data silently. Modern ELT tools like Fivetran detect schema changes automatically and propagate them, but not every organization uses those tools.
Data quality issues show up at every stage. Duplicate records, null values in required fields, date formats that do not match, currency amounts that lost decimal precision during extraction. Good pipelines include automated quality checks: row count validation (did we get the expected number of records?), distribution checks (are the values in a reasonable range?), and freshness monitoring (is the data as recent as it should be?).
Latency mismatches cause confusion when different parts of the organization expect different data freshness. The finance dashboard refreshes daily at 6 AM, but the VP of Sales expects to see yesterday’s closed deals by 8 AM. If the SAP extraction runs at midnight but the Salesforce sync finishes at 4 AM, the joined data in the morning report might show SAP revenue from yesterday alongside Salesforce pipeline numbers from two days ago. Aligning pipeline schedules across source systems is a coordination problem that gets harder as the number of sources grows.
How Power BI connects to warehouses, lakehouses, and other pipeline destinations is covered in Power BI Data Connection: How Power BI Connects to Your Data.
How Data Pipelines Fit into the Broader Enterprise Analytics Stack
A data pipeline is one layer in a larger stack. Knowing where it sits helps business users understand who owns what and where to direct questions when something goes wrong.
Source systems (SAP, Salesforce, databases, SaaS applications) generate the data. The pipeline extracts, transforms, and loads it. The warehouse or lakehouse stores it. BI tools like Power BI read from the warehouse and present it as dashboards and reports. Each layer has different owners: the business owns the source systems, data engineering owns the pipeline, the analytics team (or a shared platform team) owns the warehouse and semantic models, and business analysts own the reports.
When a number looks wrong on a dashboard, the problem could be at any layer. The source system might have bad data. The pipeline might have failed or applied an incorrect transformation. The warehouse table might be stale. The Power BI measure might have a calculation error. Understanding that a pipeline exists between the source and the report is the first step toward asking the right diagnostic question: “Is this a data problem, a pipeline problem, or a report problem?”
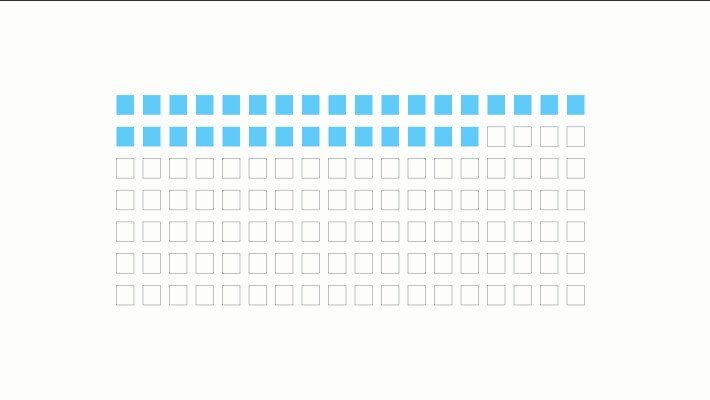
The data pipeline tools market reflects how central these systems have become. The market reached an estimated $13.65 billion in 2025 and is projected to grow at over 21% annually through 2030, driven by the shift to cloud-based architectures and increasing demand for real-time analytics. Cloud-based pipeline deployments now represent roughly 71% of the market, a clear signal that most new pipeline investment is happening in cloud-native environments.
Enterprise analytics as a discipline depends on reliable pipelines to function. If the pipeline is unreliable, every report and dashboard downstream becomes untrustworthy. A broader view of how all these components fit together is available in What Is Enterprise Analytics? A Complete Guide.