Table of Contents
Salesforce may be the main workspace for sales, customer success, service, and revenue operations teams, while Power BI remains the platform where analysts build detailed reports and combine data from multiple business systems. This setup works well for report creation. It is less convenient for report consumption. A sales manager reviewing opportunities in Salesforce may need to open Power BI separately to check pipeline coverage, forecast accuracy, or regional performance. An account manager may leave the customer workflow to review product usage or renewal risk. Leadership dashboards may exist in Power BI, but the teams expected to use them spend most of their day inside Salesforce.
Embedding Power BI in Salesforce brings selected reports into the environment where users already manage customers, opportunities, activities, and operational work.
With Power BI Connector for Salesforce, teams can create dashboard pages inside Salesforce, add Power BI reports as widgets, arrange them for different audiences, share dashboards with selected Salesforce users and groups, and track dashboard changes over time.
The reports remain hosted and managed in Power BI. Salesforce becomes an additional place where authorized users can access and use them.
How Power BI Embedding Works in Salesforce
A Power BI report is not copied or recreated in Salesforce.
The original report remains in the Power BI service. Salesforce displays it through a secure embed URL inside a dashboard widget created with Power BI Connector for Salesforce.
Users can interact with the report without opening Power BI in a separate tab, while Power BI continues to control:
- Report permissions
- User authentication
- Row-level security
- Object-level security
- Data refreshes
- Report content and visualizations
Salesforce controls the dashboard page, its layout, and which Salesforce users or groups can access it.
Power BI Reports vs. Dashboards Created in Salesforce
The term Power BI dashboard in Salesforce can create some confusion because “dashboard” also refers to a specific content type inside Power BI.
In Power BI Connector for Salesforce, a dashboard is a page created and managed inside Salesforce. One or more Power BI reports can then be added to that page as individual widgets.
Within this setup:
- The Salesforce dashboard provides the page structure.
- Each widget displays a Power BI report through a secure embed URL.
- Widget size, position, and display settings are managed inside Salesforce.
- Dashboard access is shared with selected Salesforce users and groups.
- Report content and data permissions remain managed in Power BI.
A single Salesforce dashboard can bring several related Power BI views together.
For example, a revenue dashboard may include one report widget for pipeline performance, another for forecast trends, and a third for customer retention.
The reports do not need to be built only from Salesforce data. You can embed any Power BI report the viewer is authorized to access, including reports that combine Salesforce data with finance, product, marketing, ERP, or support data.
Why Embed Power BI in Salesforce?
The main value of embedding Power BI in Salesforce lies in bringing analytics closer to the work that depends on it.
Power BI continues to provide the analytical layer. Salesforce provides the operational context and the daily user workflow.
Keep Analytics Inside the Salesforce Workflow
Many reports lose practical value because users have to remember where to find them, open another platform, locate the correct workspace, and select the right report.
A Power BI dashboard in Salesforce gives teams a more direct path from operational work to analysis.
A sales manager can review pipeline performance before updating a forecast. A customer success team can see renewal and product adoption reporting while working with customer records. A service lead can review case volume and response trends from the same environment used for daily work.
The report becomes part of a recurring business process rather than a separate reporting destination.
Make Power BI Reports Easier to Find
Power BI environments often contain multiple workspaces, semantic models, reports, and report pages.
This structure is useful for analytics teams, but it may be difficult for occasional business users to navigate. Users may know that a report exists without knowing its exact name, workspace, or location.
Embedding selected reports in Salesforce creates a focused access point.
Instead of navigating the full Power BI environment, users can open a dashboard created for their role, team, or process.
Create Dashboards for Different Teams
A company rarely needs one universal dashboard.
Sales leadership may need forecast and pipeline reporting. Regional managers may need territory performance. Account teams may focus on customer health and renewals. Executives may need a consolidated view across sales, finance, and operations.
Power BI Connector for Salesforce allows teams to create multiple dashboards and share each one with selected Salesforce users or groups.
This provides a practical way to distribute relevant reports without presenting every user with the company’s full Power BI report catalog.
Use Cross-System Power BI Analytics Inside Salesforce
Embedded Power BI reports are not limited to Salesforce data.
A Power BI report can combine information from several business systems and still be displayed inside Salesforce.
For example, an account dashboard may combine:
- Opportunities and activities from Salesforce
- Subscription and invoice data from a finance platform
- Product adoption metrics
- Support volume and SLA performance
- Marketing engagement
- Renewal and expansion indicators
Power BI handles the data model and analysis. Salesforce provides the workflow in which the analysis is used.
Keep Report Governance in Power BI
Embedding changes where a report can be accessed. It does not create a second copy of the report.
The original report remains in Power BI. Power BI continues to manage report access, data security, refreshes, calculations, and visualizations.
When analysts update the report in Power BI, Salesforce users see the updated version through the embedded widget.
Before You Embed Power BI in Salesforce
Several elements should be prepared before creating a Power BI dashboard in Salesforce.
Install Power BI Connector for Salesforce
To create Power BI dashboards inside Salesforce, start from the Power BI Connector for Salesforce listing on Salesforce AppExchange.
You can install the connector in your Salesforce environment or choose one of two trial options:
- Try in your sandbox to evaluate the connector with your organization’s data and configuration.
- Try in a test drive org to explore a preconfigured Salesforce environment with sample data without installing anything in your own org.
The test drive is useful for quickly exploring the interface and dashboard functionality. The sandbox trial is better suited for testing the connector with your existing Salesforce setup.
After installing and configuring the connector, open the Dashboards section. From there, you can create dashboard pages, add Power BI reports as widgets, configure their display, arrange the layout, and share the finished dashboard with Salesforce users and groups.
Follow the Full Installation Guide to complete the connector setup in your Salesforce environment.
Prepare a Published Power BI Report
The report must be published to the Power BI Service.
A report that exists only in Power BI Desktop cannot be embedded through the Website or portal option.
Publish the report to the correct Power BI workspace and confirm that the required users can access it.
Review Power BI Permissions and Licensing
Embedding a report does not automatically give Salesforce users permission to view it.
Each viewer must have access to the original report in Power BI. Users may also require an appropriate Power BI license unless the report is hosted in a workspace backed by eligible capacity.
Review both report permissions and licensing before sharing the dashboard.
How to Embed Power BI in Salesforce: Step-by-Step Guide
Power BI Connector for Salesforce provides a no-code dashboard workflow.
Teams can create a dashboard in Salesforce and add Power BI reports through secure embed URLs without building a separate Visualforce page, Lightning Web Component, Apex controller, or custom authentication flow.
Once the connector is installed and the Power BI report is published, follow the steps below to embed the report in Salesforce.
Step 1: Get the Secure Power BI Embed URL
Open the published report in the Power BI service.
Go to:
File → Embed report → Website or portal
Copy the secure URL provided by Power BI.
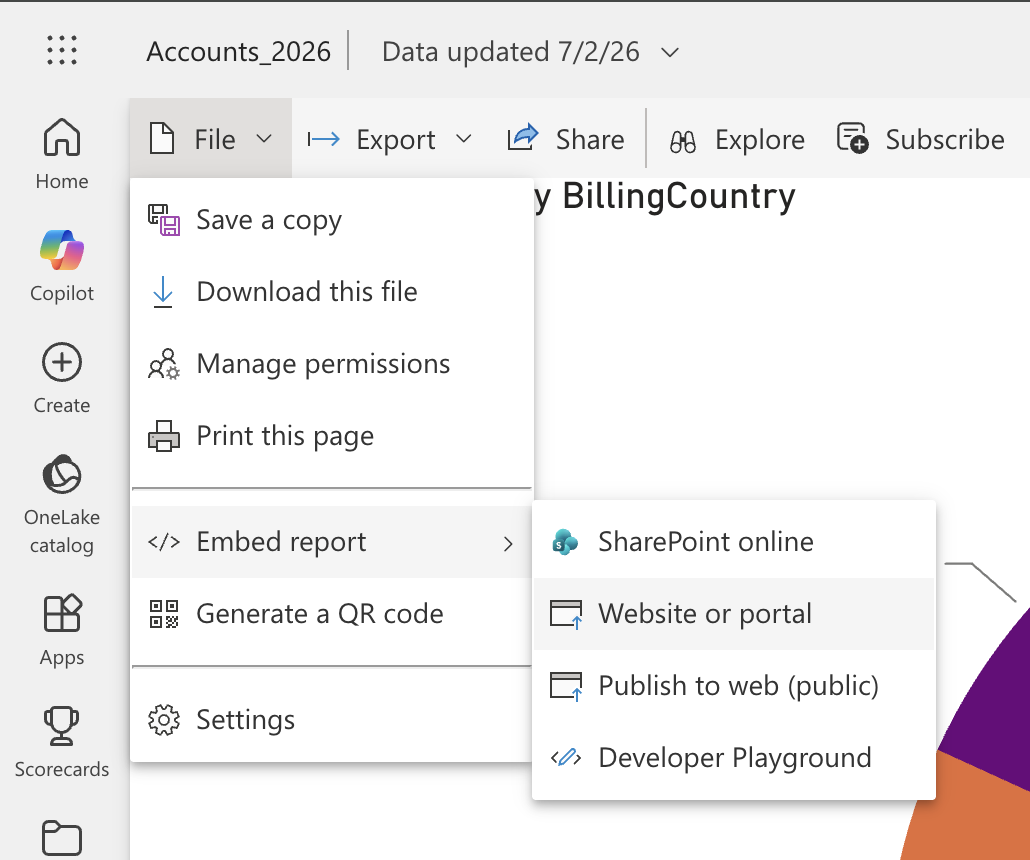
Use the Website or portal option rather than Publish to web. Publish to web makes the report publicly accessible and should not be used for internal, customer, revenue, or operational reporting.
Step 2: Create a Dashboard in Salesforce
Open Power BI Connector in Salesforce and go to the Dashboards section.
Click Create dashboard, enter a clear name, and confirm the creation.
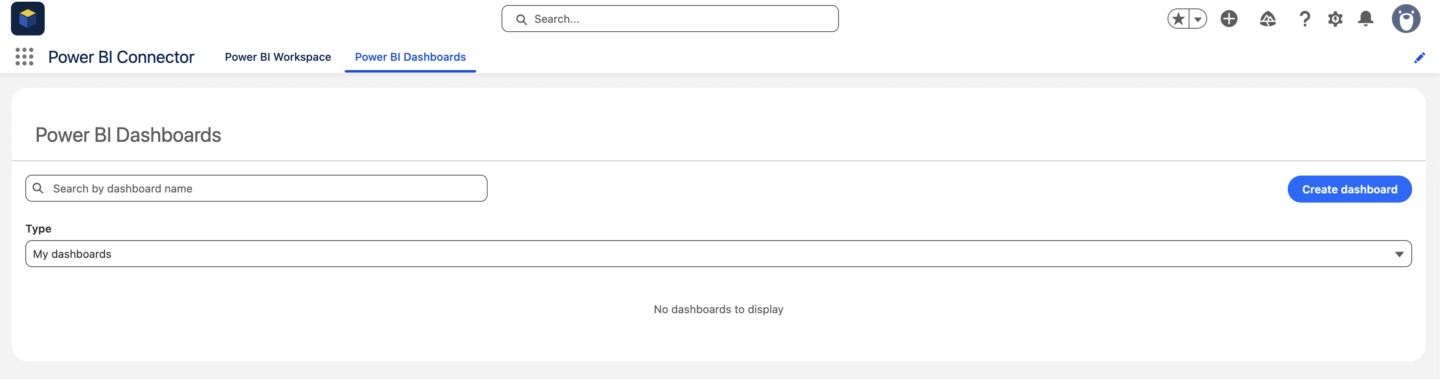
Use a name that reflects the dashboard’s purpose, such as:
- Global Sales Pipeline
- Enterprise Account Health
- Regional Forecast Review
- Revenue Operations Overview
Step 3: Add a Power BI Report Widget
Open the dashboard you created and select Edit.
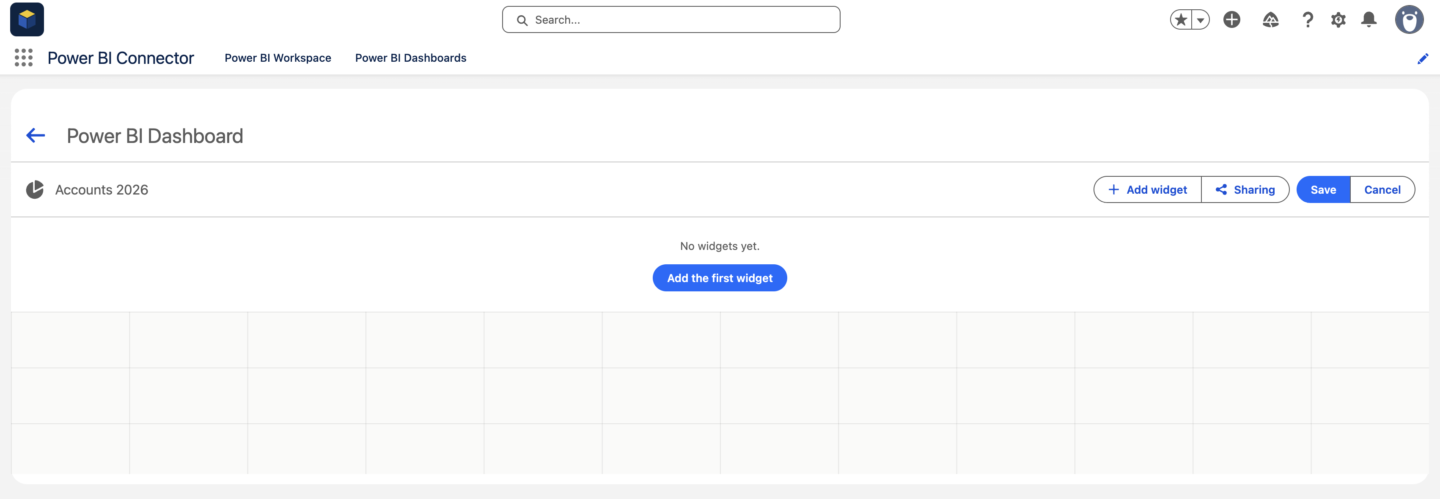
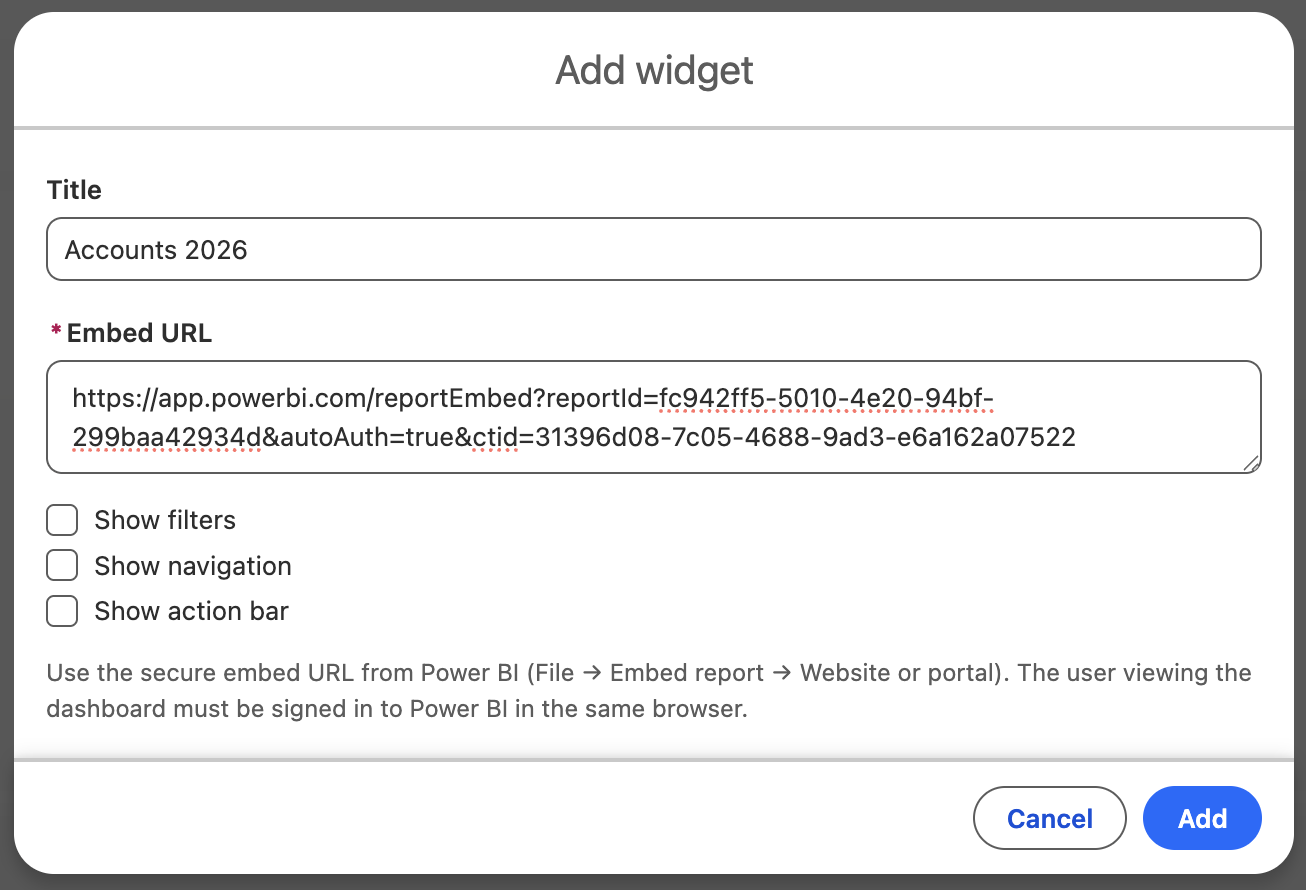
Click Add widget, then configure:
- Title: The name displayed above the report
- Embed URL: The secure Website or portal URL copied from Power BI (Step 1)
- Show filters: Displays or hides the Power BI filters pane
- Show navigation: Allows users to move between report pages
- Show action bar: Displays supported Power BI report actions
Add the widget after completing the settings.
Step 4: View the Embedded Power BI Report in Salesforce
After adding the widget, the Power BI report appears directly on the dashboard page in Salesforce.
The first time you open it, Power BI may ask you to sign in. Authenticate with your Power BI account to access the original report.
Once authorized, you can view and interact with the report without leaving Salesforce.
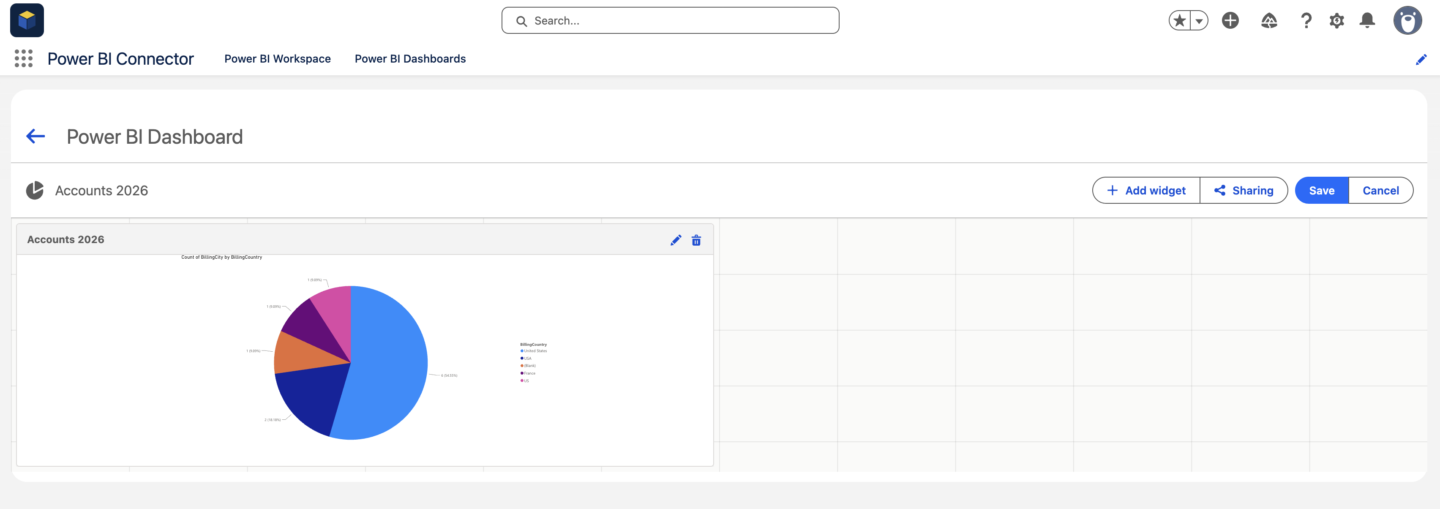
At this point, the Power BI report is embedded in Salesforce and ready to use.
You can keep the dashboard focused on this report or add more Power BI reports as separate widgets.
Step 5: Add and Arrange More Report Widgets
Add additional Power BI reports when the dashboard needs to bring several related views together.
Drag widgets to change their position and resize them on the dashboard grid. Place the most important KPIs and reports first, followed by supporting trends and detailed views.
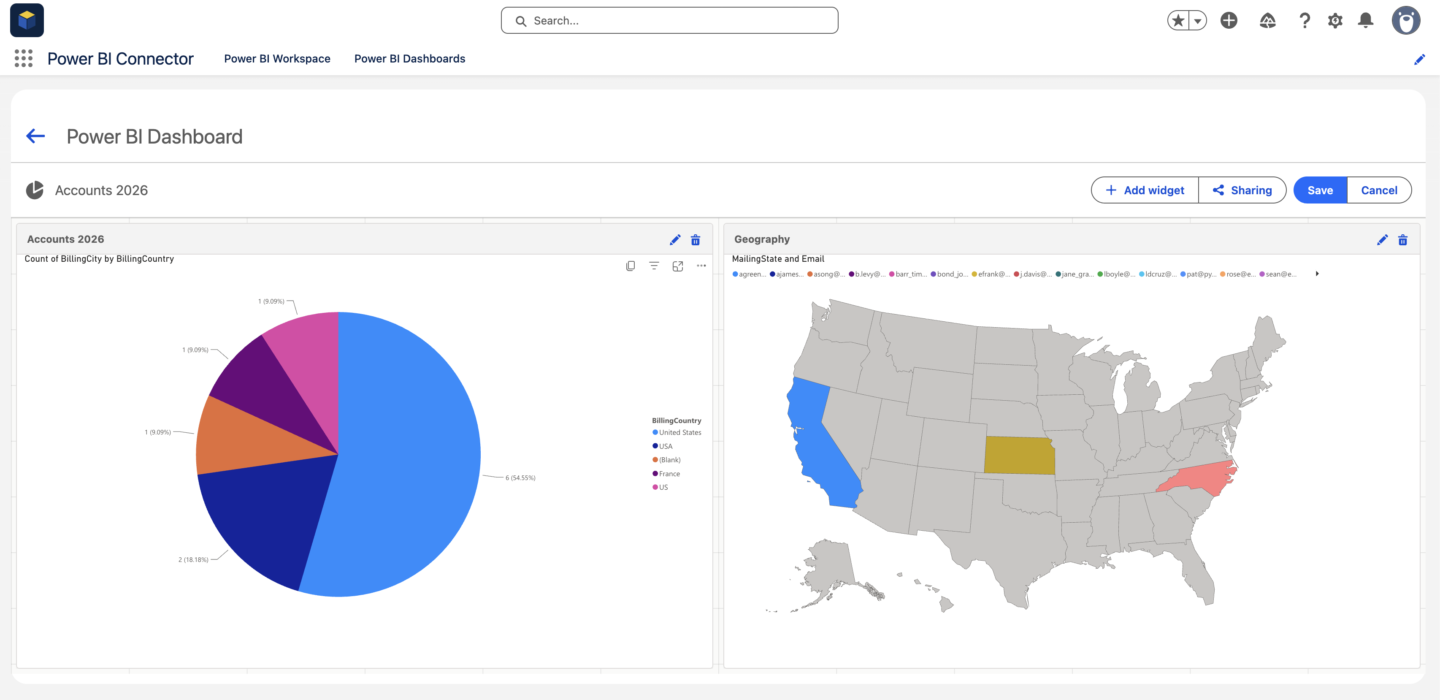
Click Save after completing the layout.
Step 6: Share the Dashboard and Verify Access
Open the dashboard’s Sharing settings and select the Salesforce users or groups that should have access.
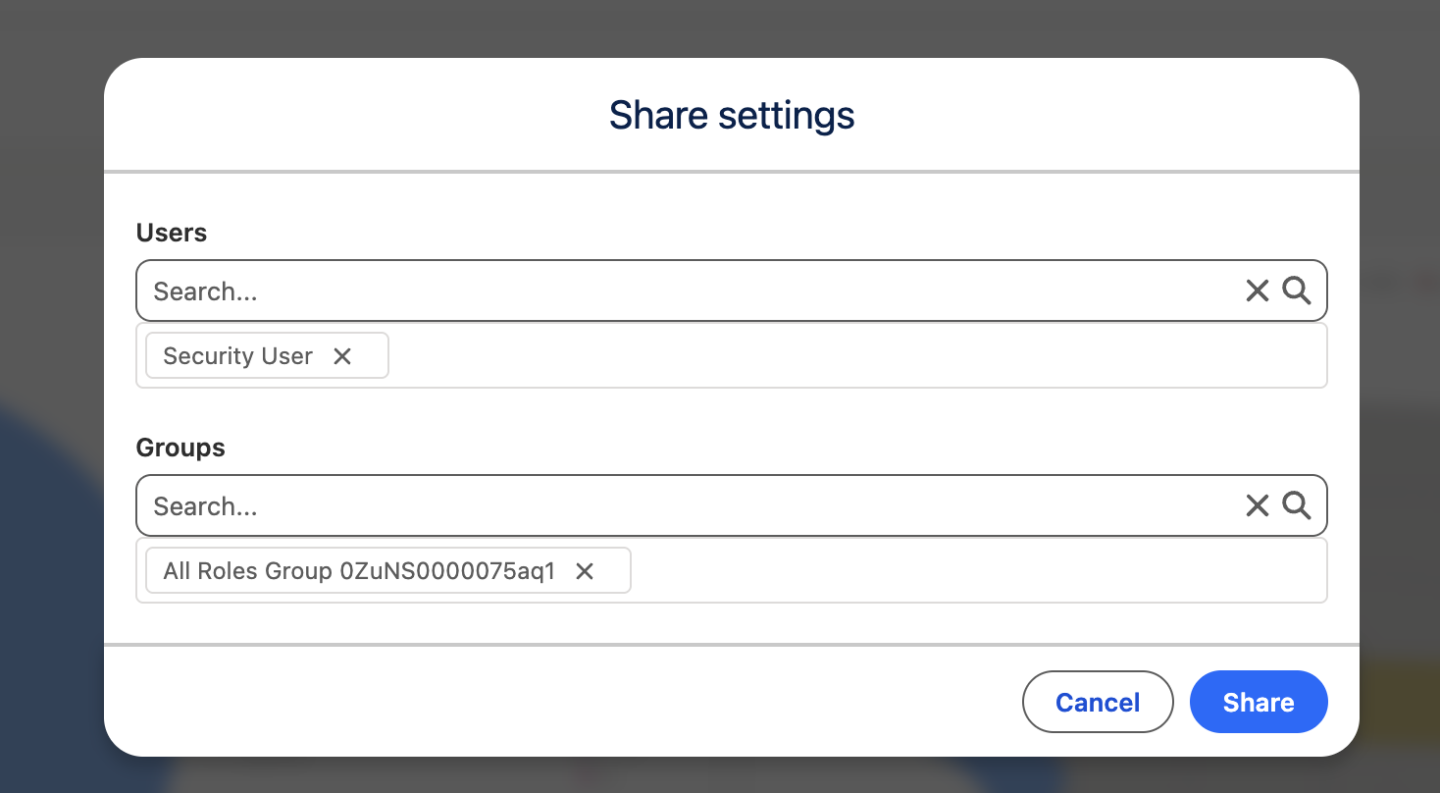
Salesforce sharing controls who can open the dashboard page. It does not grant access to the original Power BI report.
Each viewer must also:
- Have permission to view the report in Power BI
- Meet the relevant Power BI licensing or capacity requirements
- Authenticate with Power BI in the browser
Power BI continues to apply report permissions, row-level security, object-level security, and other data access rules.
Test the dashboard using an account with the same Salesforce and Power BI permissions as the intended viewer.
Step 6: Review Dashboard History
In Power BI Connector for Salesforce, open:
History → Dashboards history
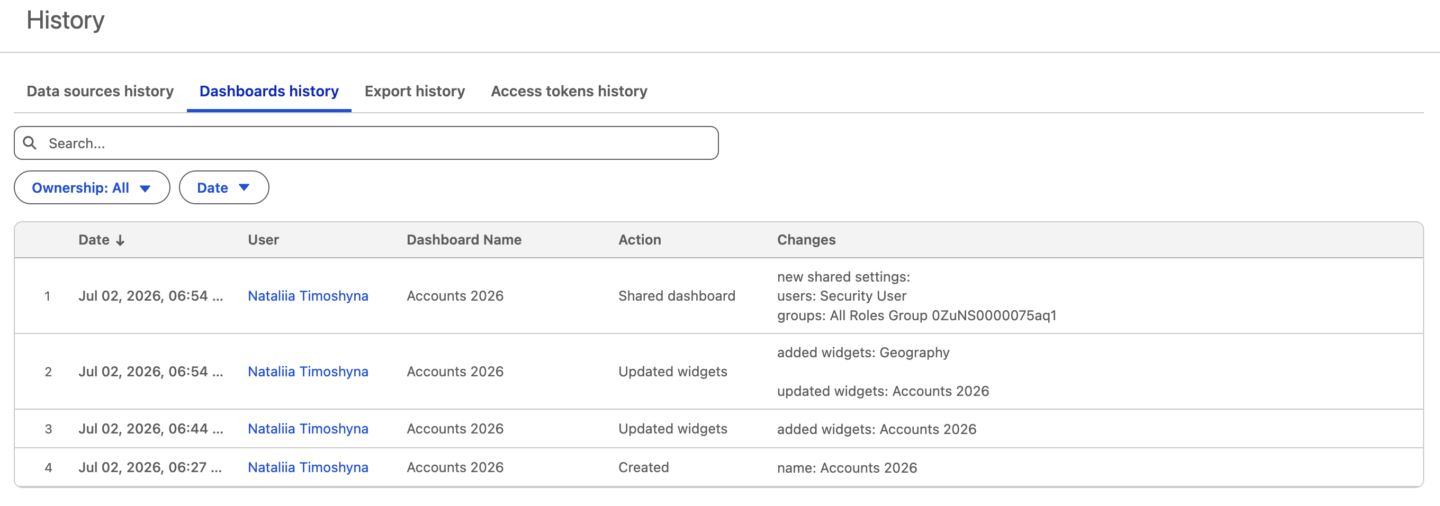
The history shows who changed the dashboard, when the change occurred, and what was updated.
Recorded activity may include dashboard creation, widget changes, layout updates, and sharing changes. This gives teams a clear record of how the dashboard configuration has changed over time.
You can also watch the video below to see how to create and manage Power BI dashboards in Salesforce.
How to Design an Effective Power BI Dashboard in Salesforce
The technical setup is only one part of the process. The dashboard also needs to work for the people using it.
Build the Dashboard Around a Decision
Start with the business decision the dashboard should support.
A forecast dashboard should help managers understand whether the pipeline is sufficient and which deals may affect the forecast.
An account health dashboard should help customer teams identify risk, engagement changes, and expansion opportunities.
The purpose should determine the reports and widgets included.
Keep Each Widget Focused
A widget should present a defined view rather than an entire analytics environment.
Dedicated Power BI pages often work better than embedding a large report with many pages, filters, and unrelated visuals.
Use Clear Widget Titles
Titles should tell users what the report shows.
Avoid generic titles such as Sales Report, Dashboard 1, Power BI Report, Analytics, etc.
Use titles such as:
- Pipeline Coverage by Segment
- Quarterly Forecast Changes
- Accounts with Declining Product Usage
- Renewal Revenue for the Next 90 Days
Prioritize the Layout
Place the most important metrics and business questions near the top.
Supporting trends and details can appear lower on the dashboard.
Users should understand the dashboard’s main purpose before they begin scrolling or opening report pages.
Test the Dashboard at Realistic Sizes
Review every embedded report inside the actual Salesforce widget.
Check whether labels remain readable, tables fit the available width, legends remain visible, and filters are easy to use.
A report that looks clear in Power BI at full-screen width may need adjustments before it works well inside Salesforce.
Common Use Cases for Power BI Dashboards in Salesforce
The dashboard structure should reflect the team using it and the decision the dashboard is expected to support.
Sales Pipeline and Forecast Dashboard
A sales dashboard can combine current Salesforce pipeline data with historical Power BI analysis.
Useful views may include:
- Pipeline by stage, region, or segment
- Pipeline coverage against targets
- Forecast changes over time
- Opportunity aging
- Deal slippage
- Win rate
- Sales cycle length
- Expected and weighted revenue
Sales managers can use the dashboard during pipeline and forecast reviews while continuing to manage opportunities in Salesforce.
Customer and Account Health Dashboard
A customer dashboard can combine Salesforce account data with product, finance, and service information.
It may include:
- Contract and renewal dates
- Product adoption
- Support ticket volume
- Customer engagement
- Open opportunities
- Payment or invoice status
- Customer health indicators
- Expansion potential
This is particularly useful when customer context is distributed across several systems.
Revenue Operations Dashboard
Revenue operations teams often need to compare performance across marketing, sales, customer success, and finance.
A Power BI dashboard in Salesforce can show:
- Lead and opportunity conversion
- Pipeline creation
- Forecast accuracy
- Revenue attainment
- Customer acquisition cost
- Retention and expansion
- Territory performance
- Funnel movement
Power BI combines the underlying sources, while Salesforce gives business users a familiar location from which to access the analysis.
Executive Performance Dashboard
Leadership dashboards usually need fewer operational details and more consistent cross-functional measures.
An executive dashboard in Salesforce may include Power BI reports for:
- Revenue and bookings
- Forecast versus plan
- Pipeline health
- Customer retention
- Regional performance
- Product performance
- Service quality
- Financial trends
Making these reports available inside Salesforce can help include analytics in regular leadership and operating reviews.
Service and Support Dashboard
Service leaders can use embedded Power BI reports to review:
- Case volume and backlog
- Response and resolution times
- SLA performance
- Escalations
- Customer satisfaction
- Support trends by product or customer
- Account revenue alongside service activity
This helps teams evaluate service performance within broader customer and commercial context.
Also Need to Connect Salesforce Data to Power BI?
Embedding brings Power BI reports into Salesforce, but Power BI Connector for Salesforce also lets you export any Salesforce data and reports to Power BI for analysis.
Teams can create Power BI data sources from Salesforce objects, fields, relationships, and filtered records.
You can bring the Salesforce objects and fields you need into Power BI or use existing Salesforce reports, including joined reports, as the basis for a Power BI data source.
This means you can first make Salesforce data available for Power BI analysis and then embed the resulting reports back into Salesforce when they are ready for business users.
For the complete Power BI Salesforce integration process, read Connect Salesforce to Power BI: Step-by-Step Integration with Power BI Connector for Salesforce.
Frequently Asked Questions
Can You Embed Power BI in Salesforce Without Custom Development?
Yes.
Power BI Connector for Salesforce provides a dashboard interface where users can create Salesforce dashboards and add reports through secure Power BI embed URLs.
This removes the need to build a separate Visualforce page, Apex implementation, Lightning Web Component, or custom authentication flow for the dashboard.
Can a Salesforce Dashboard Contain Multiple Power BI Reports?
Yes.
Each report is added as a separate widget. Widgets can be arranged and resized on the Salesforce dashboard grid.
Can I Embed a Power BI Report Built on Data Other Than Salesforce?
Yes.
The report may use Salesforce data, data from another platform, or a model that combines several sources. Basically, you can embed any Power BI report in Salesforce.
The viewer must still have access to the report in Power BI.
Can I Embed a Power BI Dashboard in Salesforce?
Power BI Connector for Salesforce embeds Power BI reports as widgets inside dashboards created in Salesforce.
Several report widgets can be combined to create a Power BI dashboard experience inside Salesforce.
Do Salesforce Users Need Power BI Access?
Yes.
The Salesforce dashboard may be shared with a user, but the user still needs permission to view each embedded report in Power BI.
The user must also meet the relevant Power BI licensing or capacity requirements.
Does Embedding a Power BI Report Make It Public?
No, provided that you use the secure Website or portal embed option.
The secure embed URL requires Power BI authentication and preserves the original report permissions.
Publish to web is different. It creates publicly accessible content and should not be used for internal or confidential Salesforce reporting.
Can Users Filter Embedded Power BI Reports?
Yes.
The widget settings allow dashboard creators to show or hide the Power BI filters pane.
Users can apply the available filters according to their Power BI permissions and the report configuration.
Can Users Navigate Between Power BI Report Pages?
Yes.
Navigation can be enabled when adding or editing a dashboard widget.
It can also be hidden when the widget should display only one focused report page.
Can Power BI Connector for Salesforce Export Salesforce Data to Power BI?
Yes.
The connector allows teams to create reusable data sources from standard and custom Salesforce objects, select the required fields and relationships, and apply filters before importing the data into Power BI.
It can also create Power BI data sources from Salesforce reports, including joined reports.
See the Salesforce to Power BI integration guide for the complete connection process.
Bring Power BI Analytics Into the Salesforce Workflow
Embedding Power BI in Salesforce gives CRM users direct access to governed analytics without requiring them to leave their daily workflow.
With Power BI Connector for Salesforce, teams can create dashboard pages in Salesforce, embed one or several Power BI reports, control dashboard sharing, and keep report permissions and data security managed in Power BI.
Try Power BI Connector for Salesforce on Salesforce AgentExchange.
For the exact dashboard configuration and product interface steps, see the official How to Create and Manage Power BI Dashboards documentation.