Power BI Connector for SAP turns your SAP OData services into shareable OData feeds that Power BI Desktop and the Power BI service can read with a personal access token. This page introduces what the connector does, gives you a quick tour of the app, and walks you through the four steps from your first sign-in to a Power BI report bound to SAP data.
What the connector does #
Bundle one or more SAP OData services, pick the entities and fields you care about, and publish the result as a single OData URL. Point Power BI at that URL, authenticate with a personal access token, and you have a live connection to SAP without extracts, staging tables, or a middle-tier ETL.
Because the connector sits inside your SAP BTP subaccount and talks to S/4HANA through the standard Destination Service, SAP stays the single source of truth — row-level authorizations, business rules, and audit trails all continue to apply.
Key capabilities #
- Read from any activated OData service. Combine multiple SAP services in a single data source and expose them behind one URL.
- Field-level selection. Choose only the entities and fields Power BI should see; keep the rest of the SAP model out of the report.
- Row filters pushed to SAP. Trim the dataset on the SAP side instead of pulling everything and filtering in Power BI.
- Personal access tokens. Each user authenticates Power BI with their own token, so activity is attributable and revocable.
- Share on your terms. A data source belongs to its creator; sharing is explicit, per user, and revocable at any time.
- Runs where your SAP lives. Deployed to your BTP subaccount — on-premise, Private Cloud, or S/4HANA Public Cloud — and reachable from Power BI Desktop and the Power BI service.
Sign in and get oriented #
Open the connector URL provided by your administrator. The app authenticates against the SAP BTP identity provider of your tenant. After signing in, you land on the Data Sources page — your home base.

Two connector roles determine what you can do:
- User — create, edit, share, and consume your own data sources; create personal access tokens.
- Admin — everything a User does, plus the Administration page (token expiry policy and similar tenant-wide settings).
Toolbar #

- Menu — collapses the side navigation.
- Power BI Connector (logo) — returns you to the Data Sources list from anywhere.
- Headset — opens the support channel configured for your tenant.
- Question mark — opens the in-app help dialog.
- Palette — toggles between light and dark theme. The setting is per-browser.
- Your email — the account you’re signed in with.
- Log out — ends your session.
Side navigation #

- Data Sources — the list of your data sources plus the entry point for creating new ones.
- Templates — reserved for a future feature. The item is currently non-interactive.
- Data Relationships — an ERD explorer for any SAP service. See Explore data relationships.
- Access Tokens — create and manage personal access tokens used by Power BI. See Create an access token.
- History — audit log of data-source, token, and export events. See View activity history.
- Administration — visible only with the admin role. See Configure the token expiry policy.
In-app help #
The question-mark icon in the toolbar opens a help dialog with a short quick-start checklist and links back into this documentation portal. Use it as a quick refresher when you forget the exact sequence of steps.
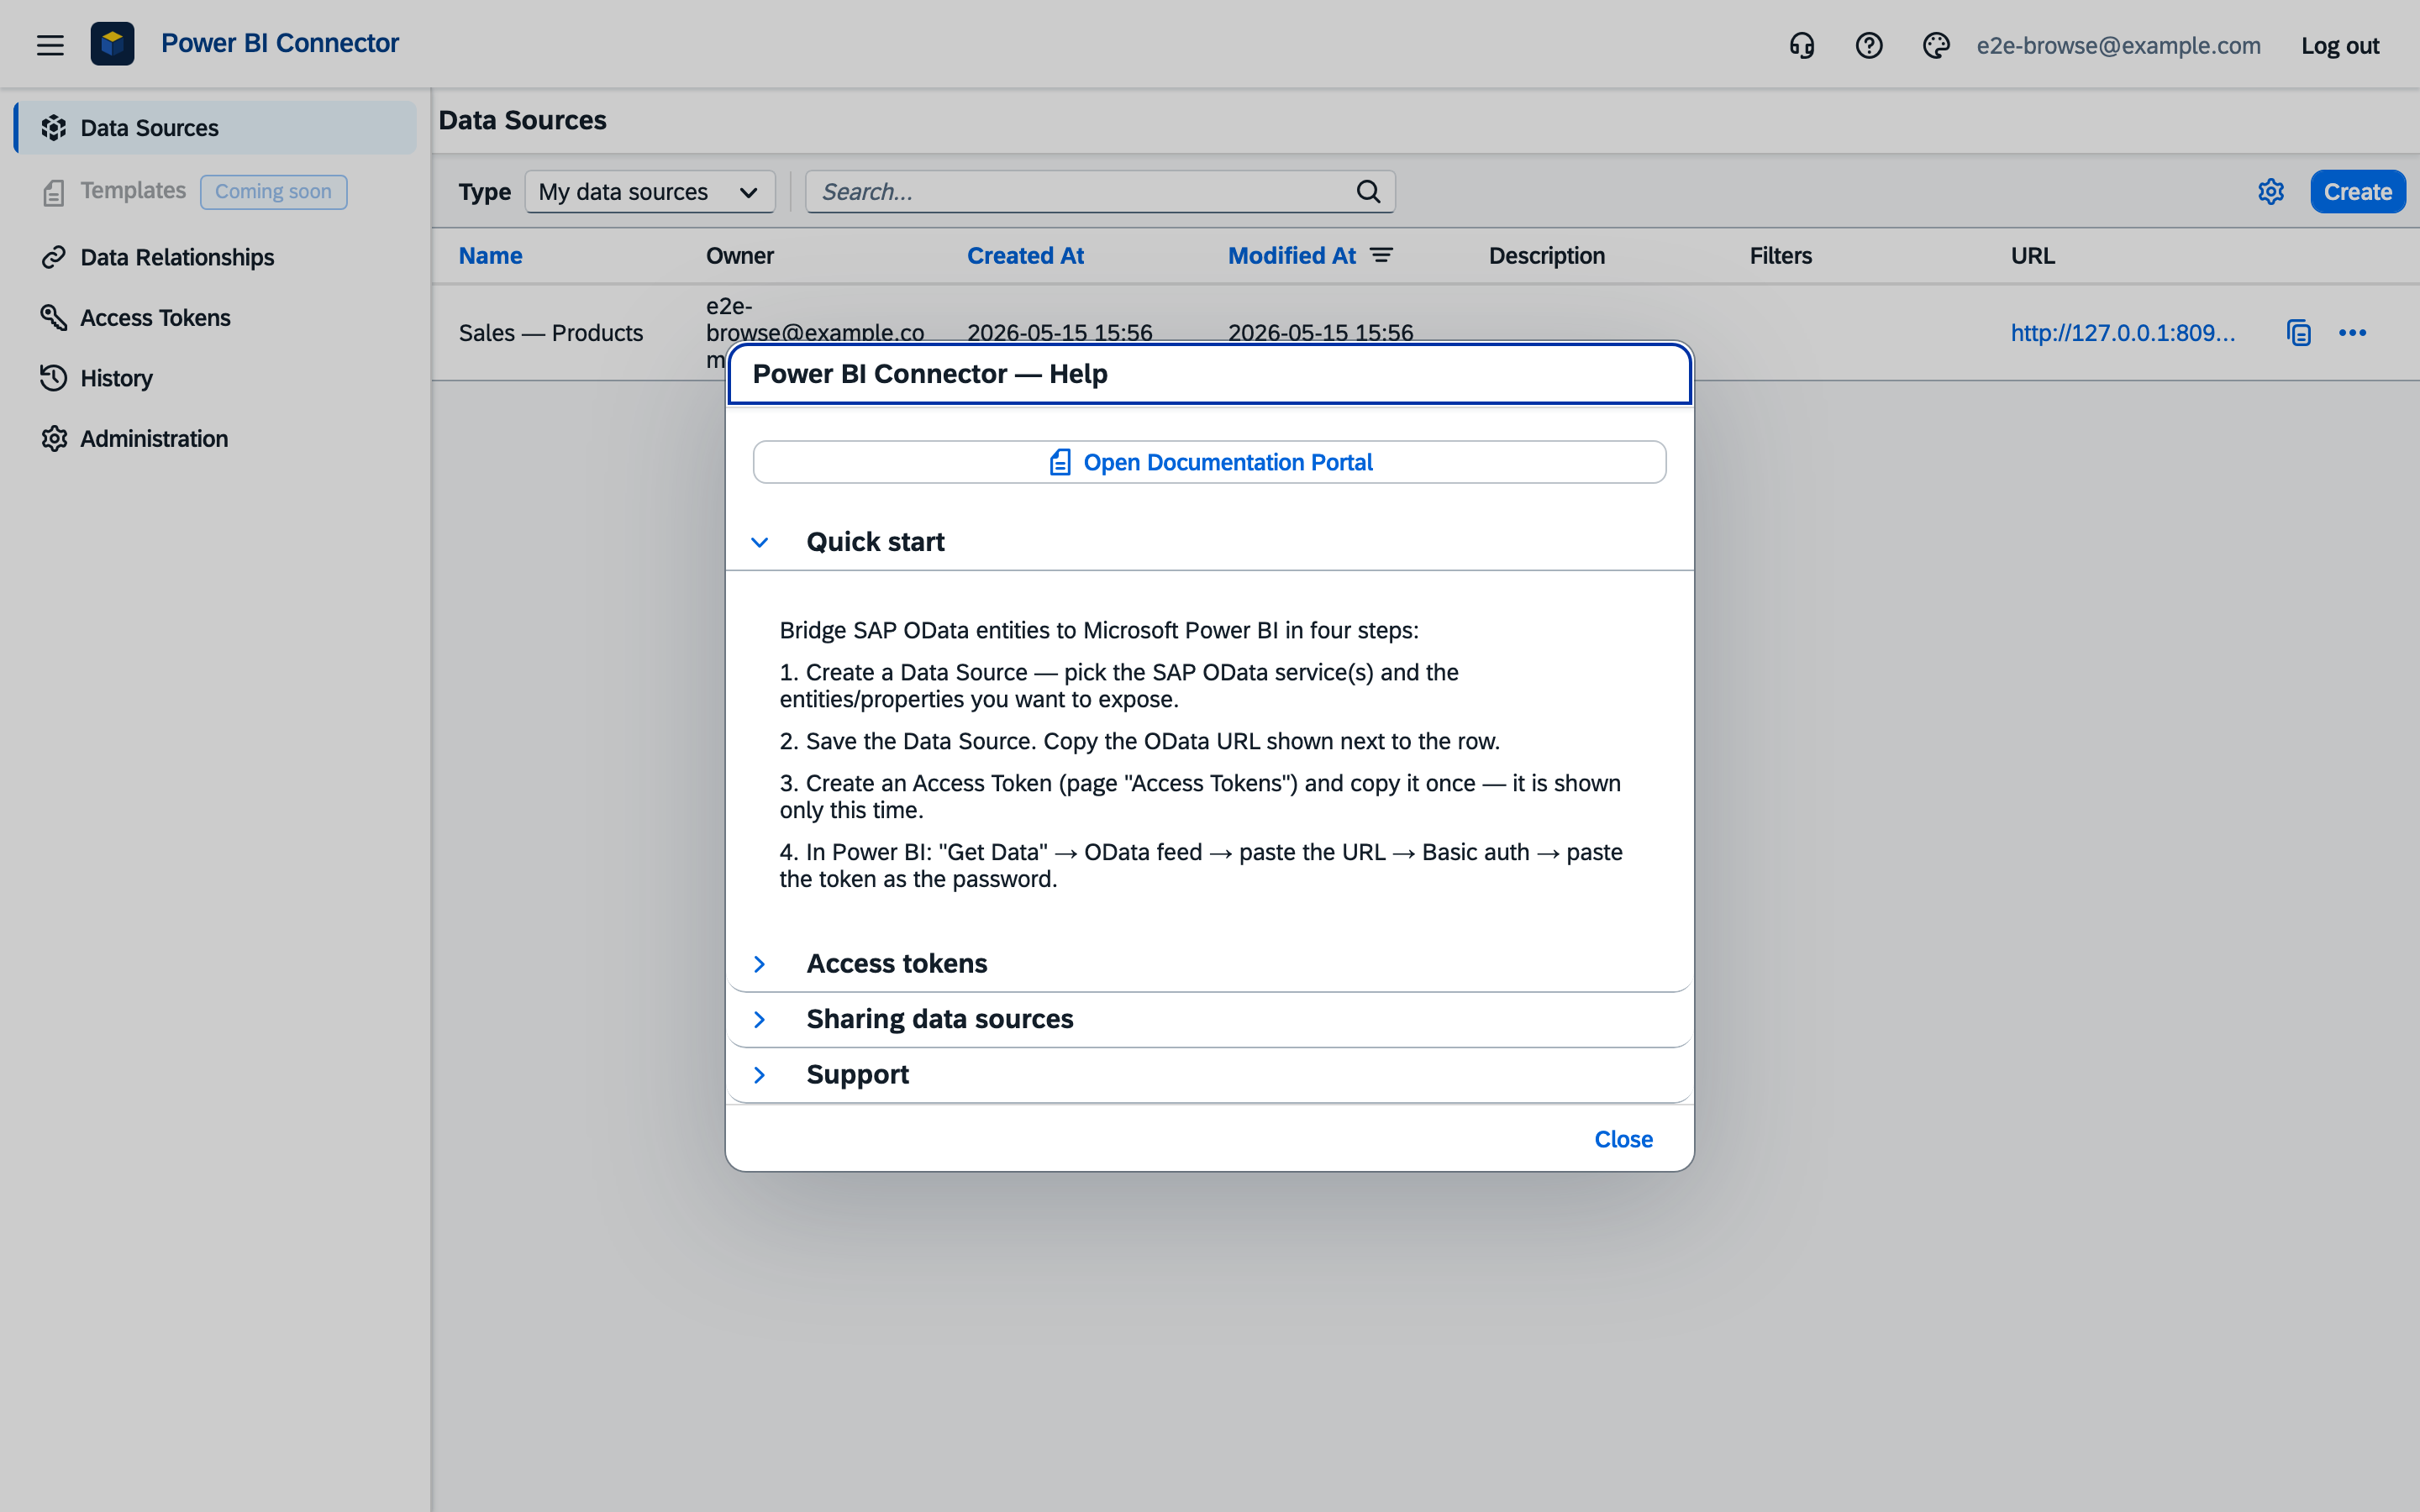
Quickstart: zero to first Power BI report #
The fastest path from a signed-in Data Sources page to a Power BI report fed by SAP data. Four steps — each links to a dedicated long-form guide if you want more detail.
Step 1 — Sign in #
Open the connector URL and sign in via your BTP identity provider. You land on the Data Sources page. If you don’t see it, refer to the Sign in and get oriented section above.
Step 2 — Create an access token #
Power BI authenticates to the connector with HTTP Basic auth: your user name plus a personal access token. Create the token now — once you start in Power BI you won’t want to backtrack.
- In the side navigation, select Access Tokens.
- Select Create token, give it a label (for example, Power BI Desktop — laptop), and confirm.
- Copy the token value from the follow-up dialog. The connector never displays it again.

Long-form: Create an access token.
Step 3 — Create a data source #
A data source bundles one or more SAP OData services, a selection of entities and fields, and optional row filters into a single OData endpoint that Power BI can read.
- On Data Sources, select Create.
- Give the data source a name. The description and sharing list are optional — you can add them later.
- Select Add Service, search the SAP service catalog, and pick the service you want to read from.
- Expand the service, then the entity, and tick the fields you want Power BI to see. The eye icon previews a sample of rows so you can sanity-check.
- Select Save. You return to the Data Sources list with the new row at the top.
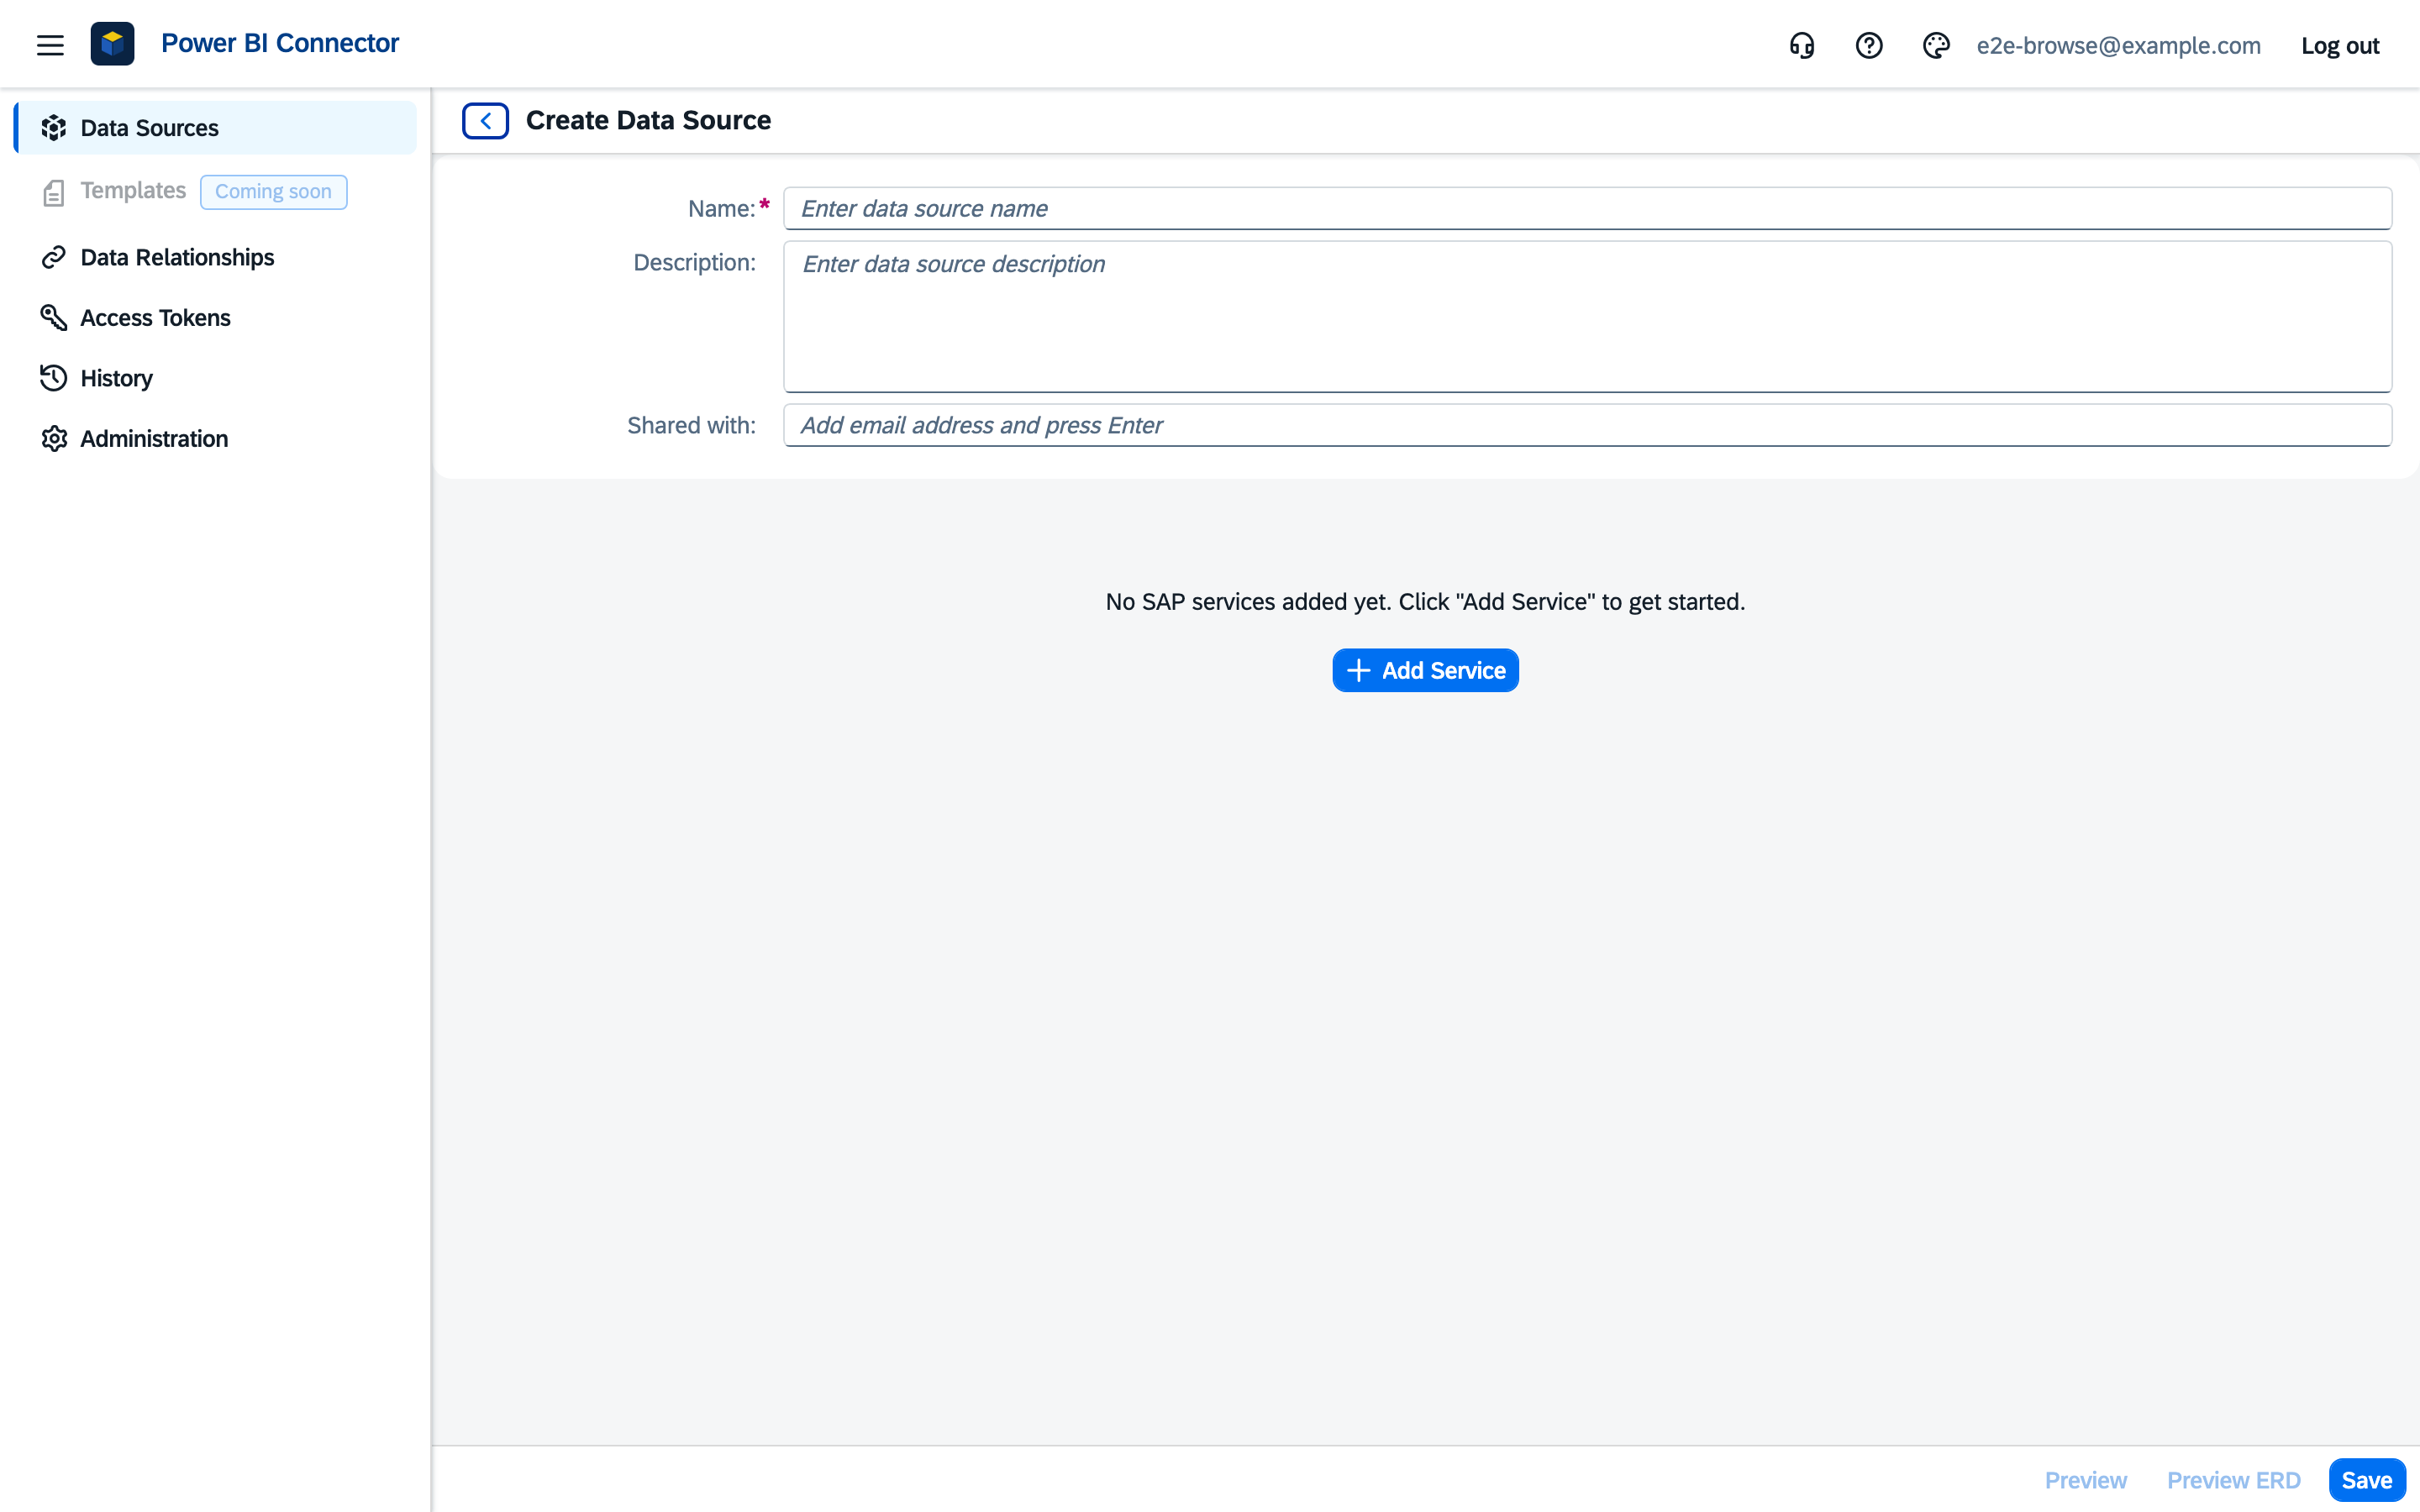
Long-form: Create a data source.
Step 4 — Connect Power BI #
On the Data Sources list, your new row has a unique OData URL in the URL column. The copy icon next to it copies the full URL to the clipboard.

- In Power BI Desktop, select Get data → OData feed.
- Paste the data source URL.
- When prompted for credentials, choose Basic. The user name is your connector account; the password is the access token you copied in Step 2.
- Confirm. Power BI fetches the metadata, lists every entity in the data source, and lets you pick which ones to load into the model.
From here you build the report as you would with any other OData feed. Long-form: Connect Power BI Desktop.
Next steps #
- Schedule refresh in Power BI service — keep the dataset fresh without manual reloads.
- Share a data source — let teammates read it from their own Power BI.
- Filter rows — trim the dataset on the SAP side instead of in Power BI.
- Explore data relationships — browse the ERD of any SAP service before picking entities.


