Since version 1.4.0, Power BI Connector for Salesforce includes a Dashboards section that lets you assemble Power BI reports into dashboards directly inside Salesforce. You build a report in Power BI on your exported Salesforce data, embed it as a widget, arrange widgets on a grid, and share the result with Salesforce users and groups. Widgets are not limited to reports built on Salesforce data — you can embed any Power BI report you have access to, bringing data from other systems into Salesforce through Power BI.
1. Open Dashboards #
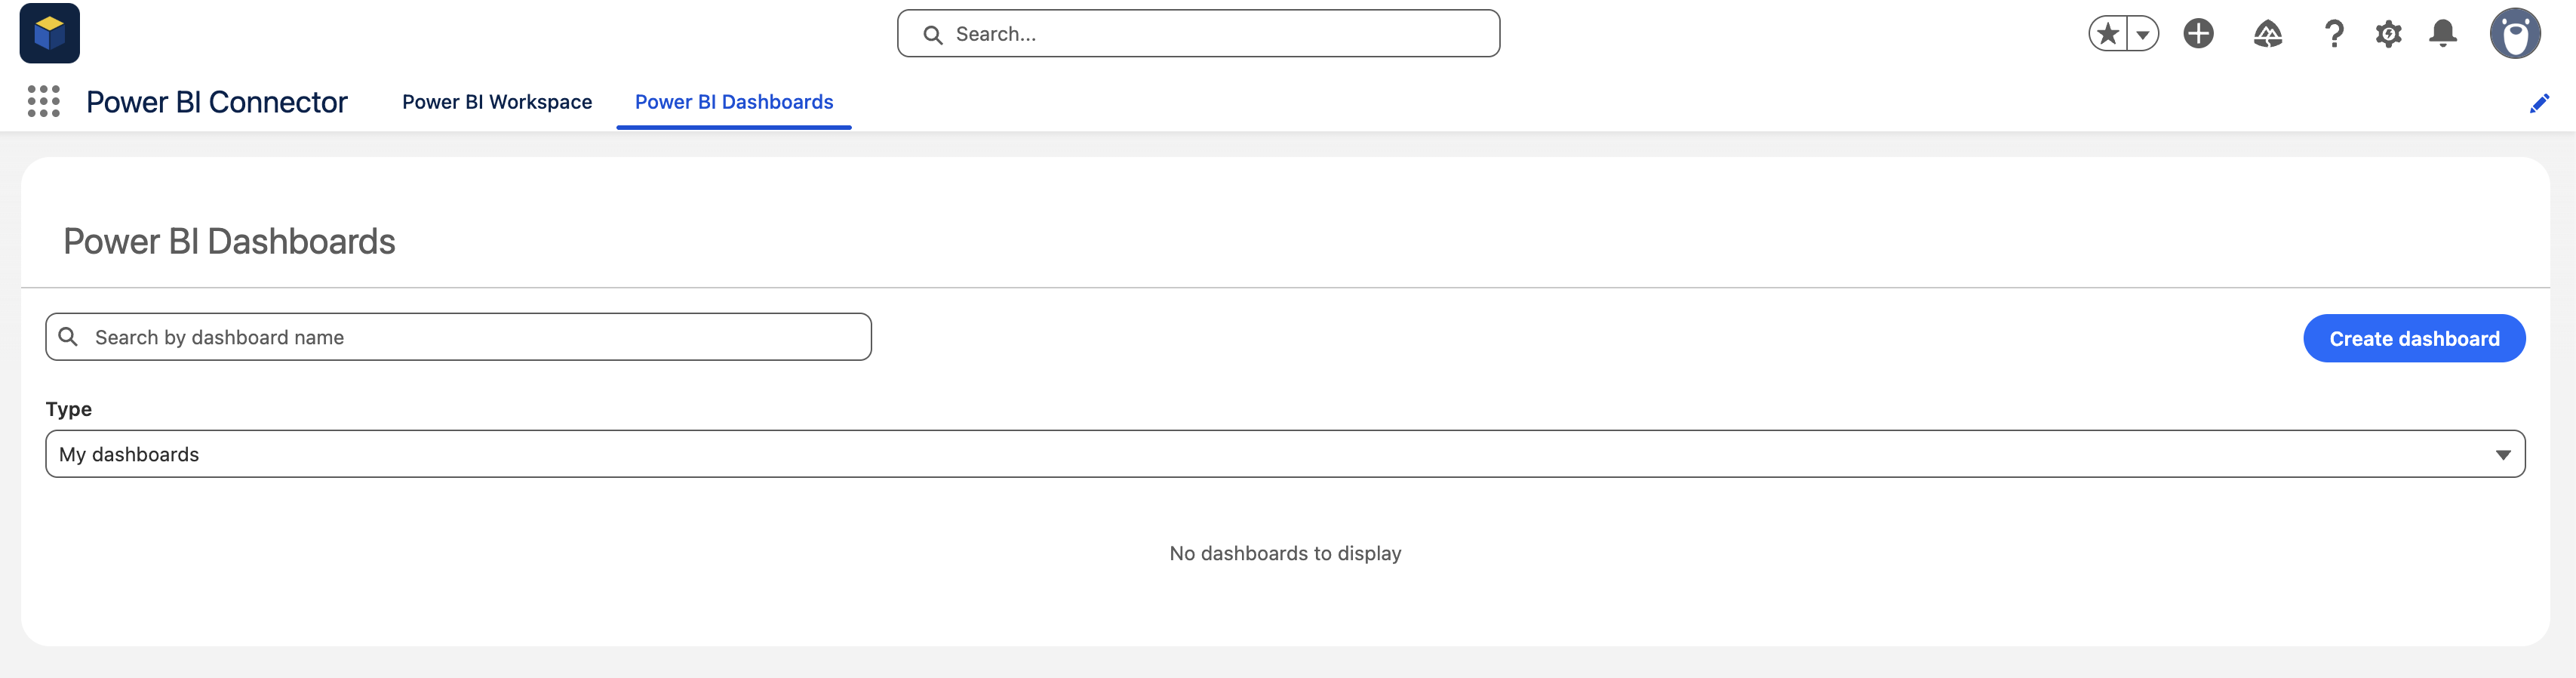
Go to Power BI Connector → Dashboards to open the Power BI Dashboards page. Here you can search dashboards by name, filter by Type (e.g., My dashboards), and create new dashboards.
2. Create a Dashboard #
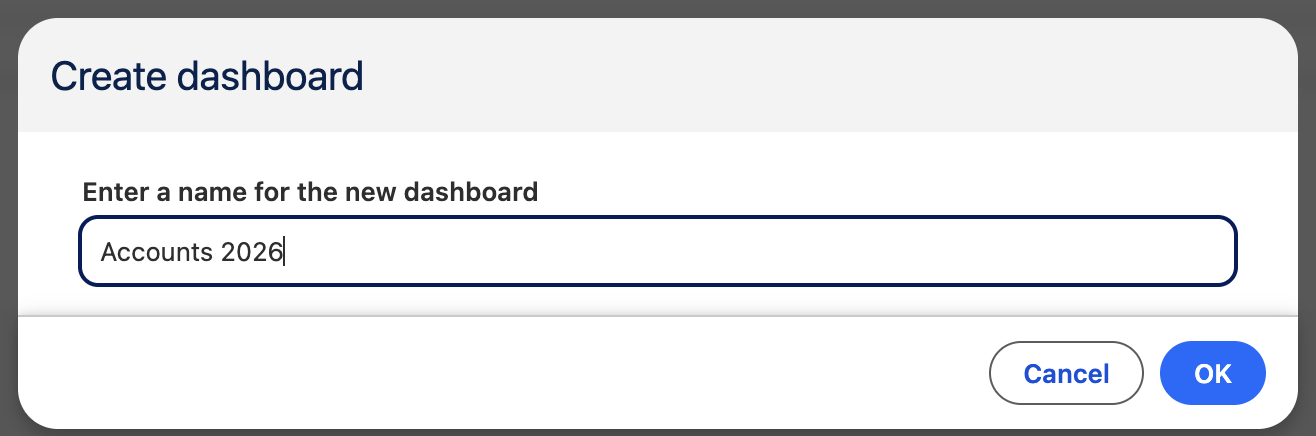
Click Create dashboard, enter a name, and confirm with OK.
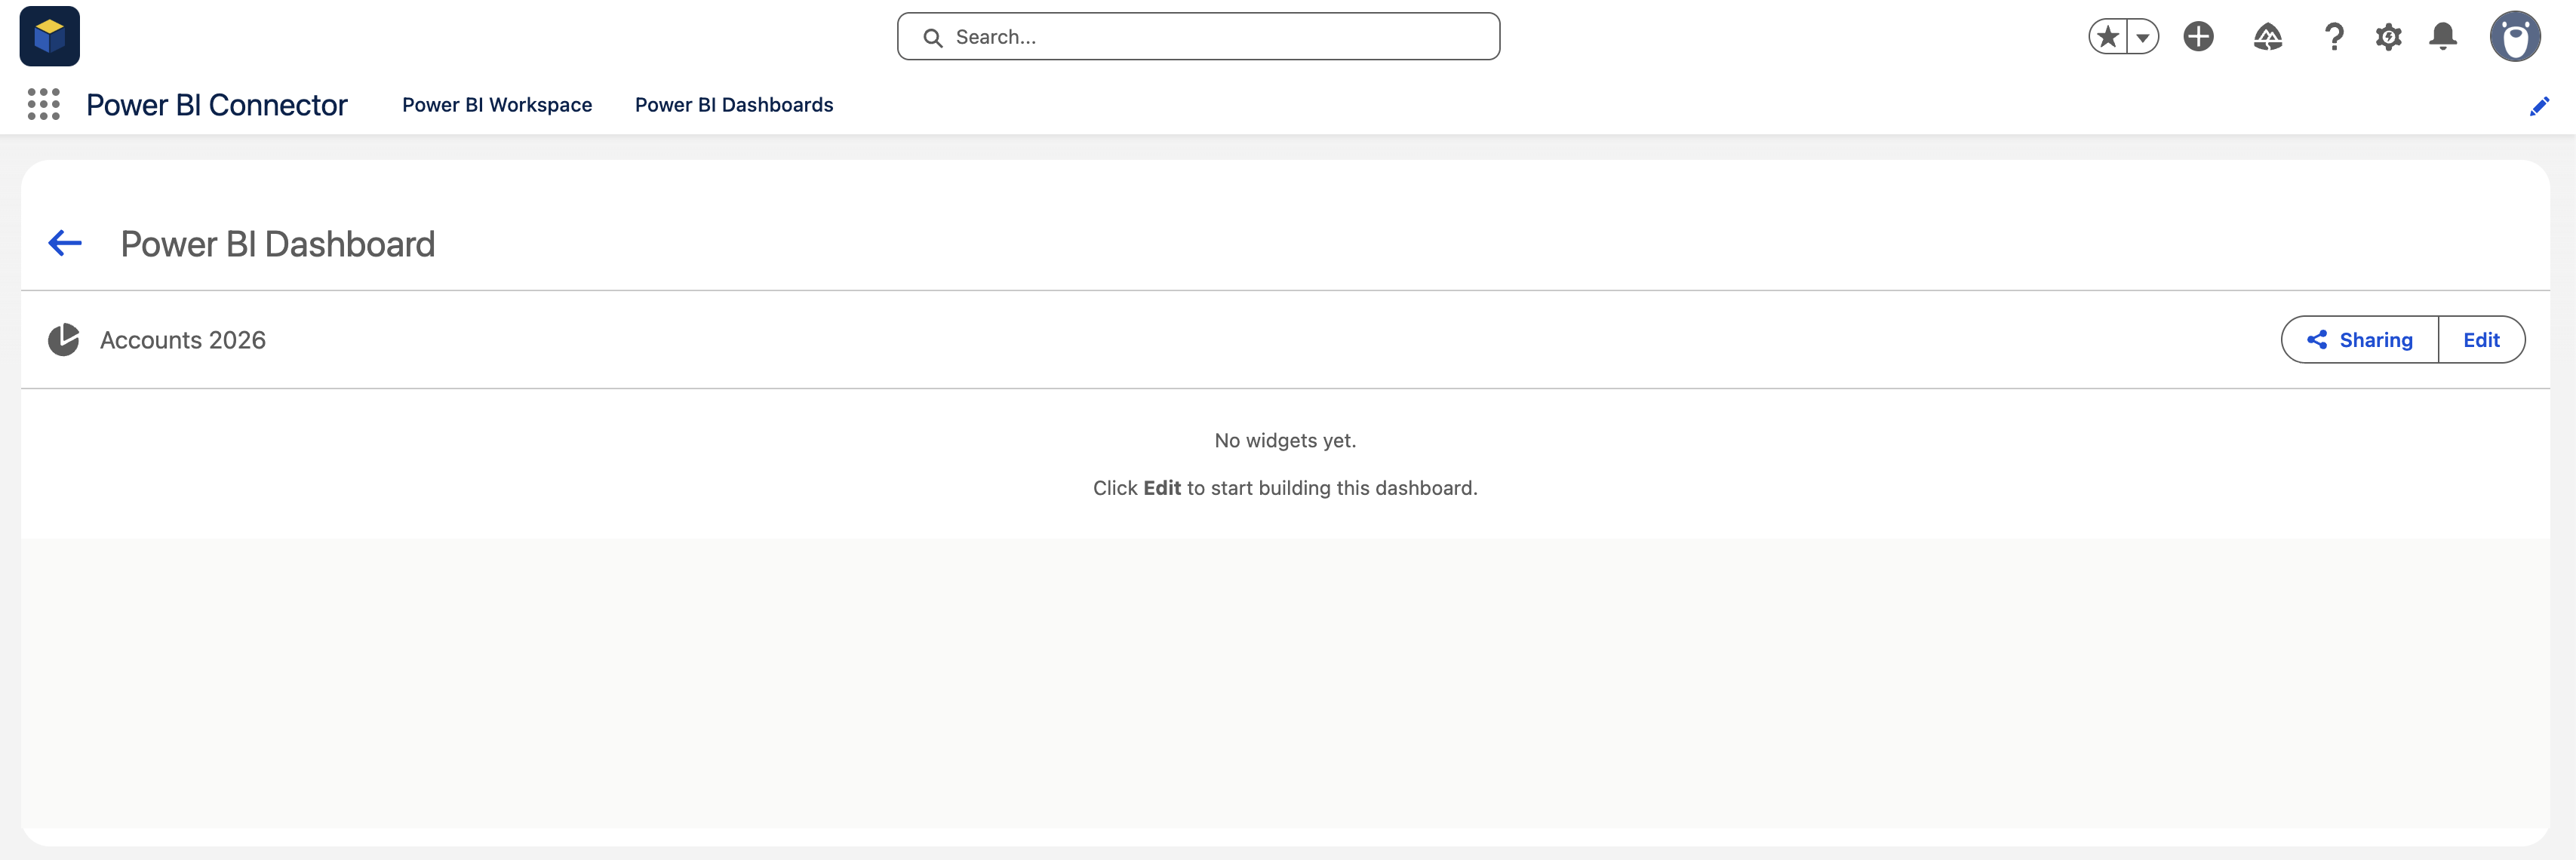
The new dashboard opens empty. Click Edit to start building it.
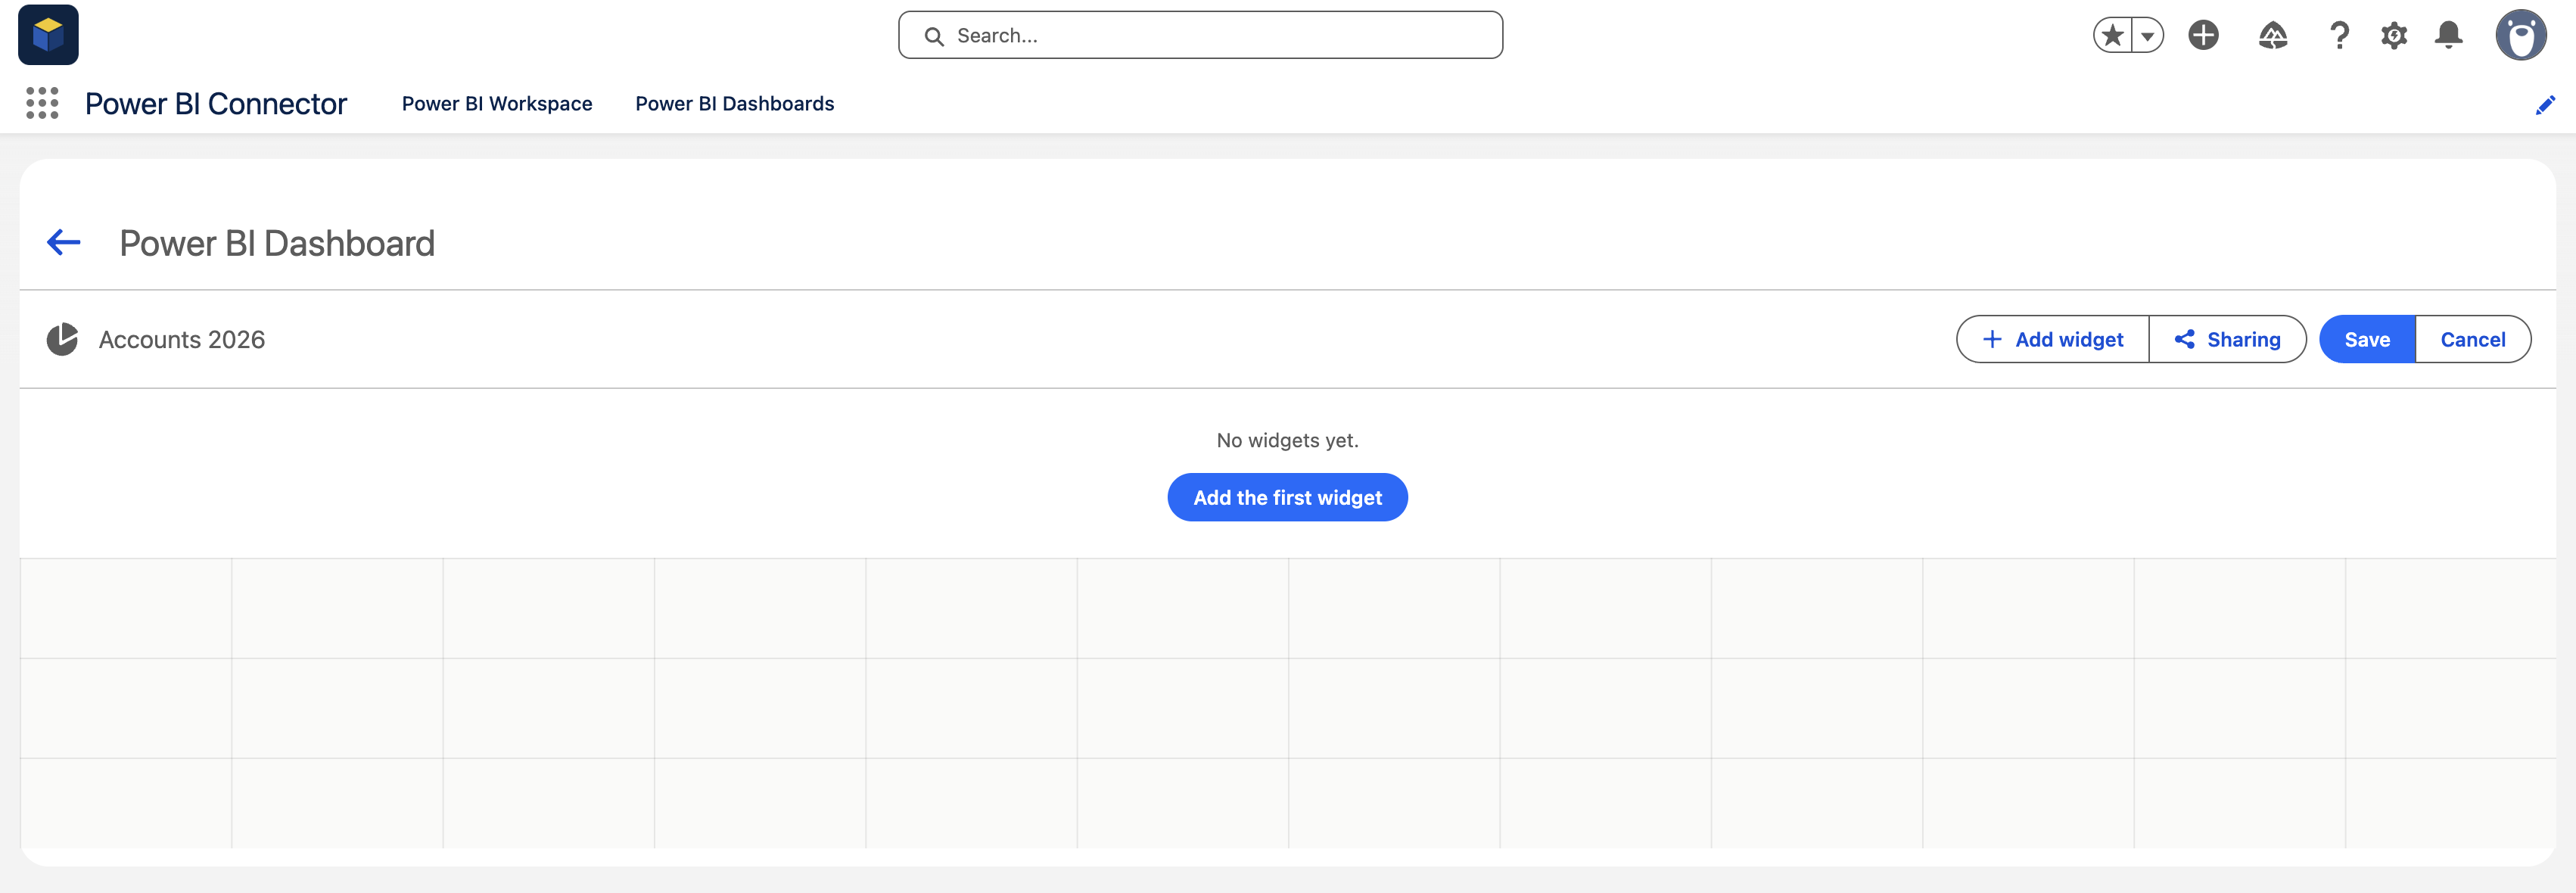
In edit mode, a layout grid appears where widgets can be added, resized, and arranged.
3. Get a Secure Embed URL from Power BI #
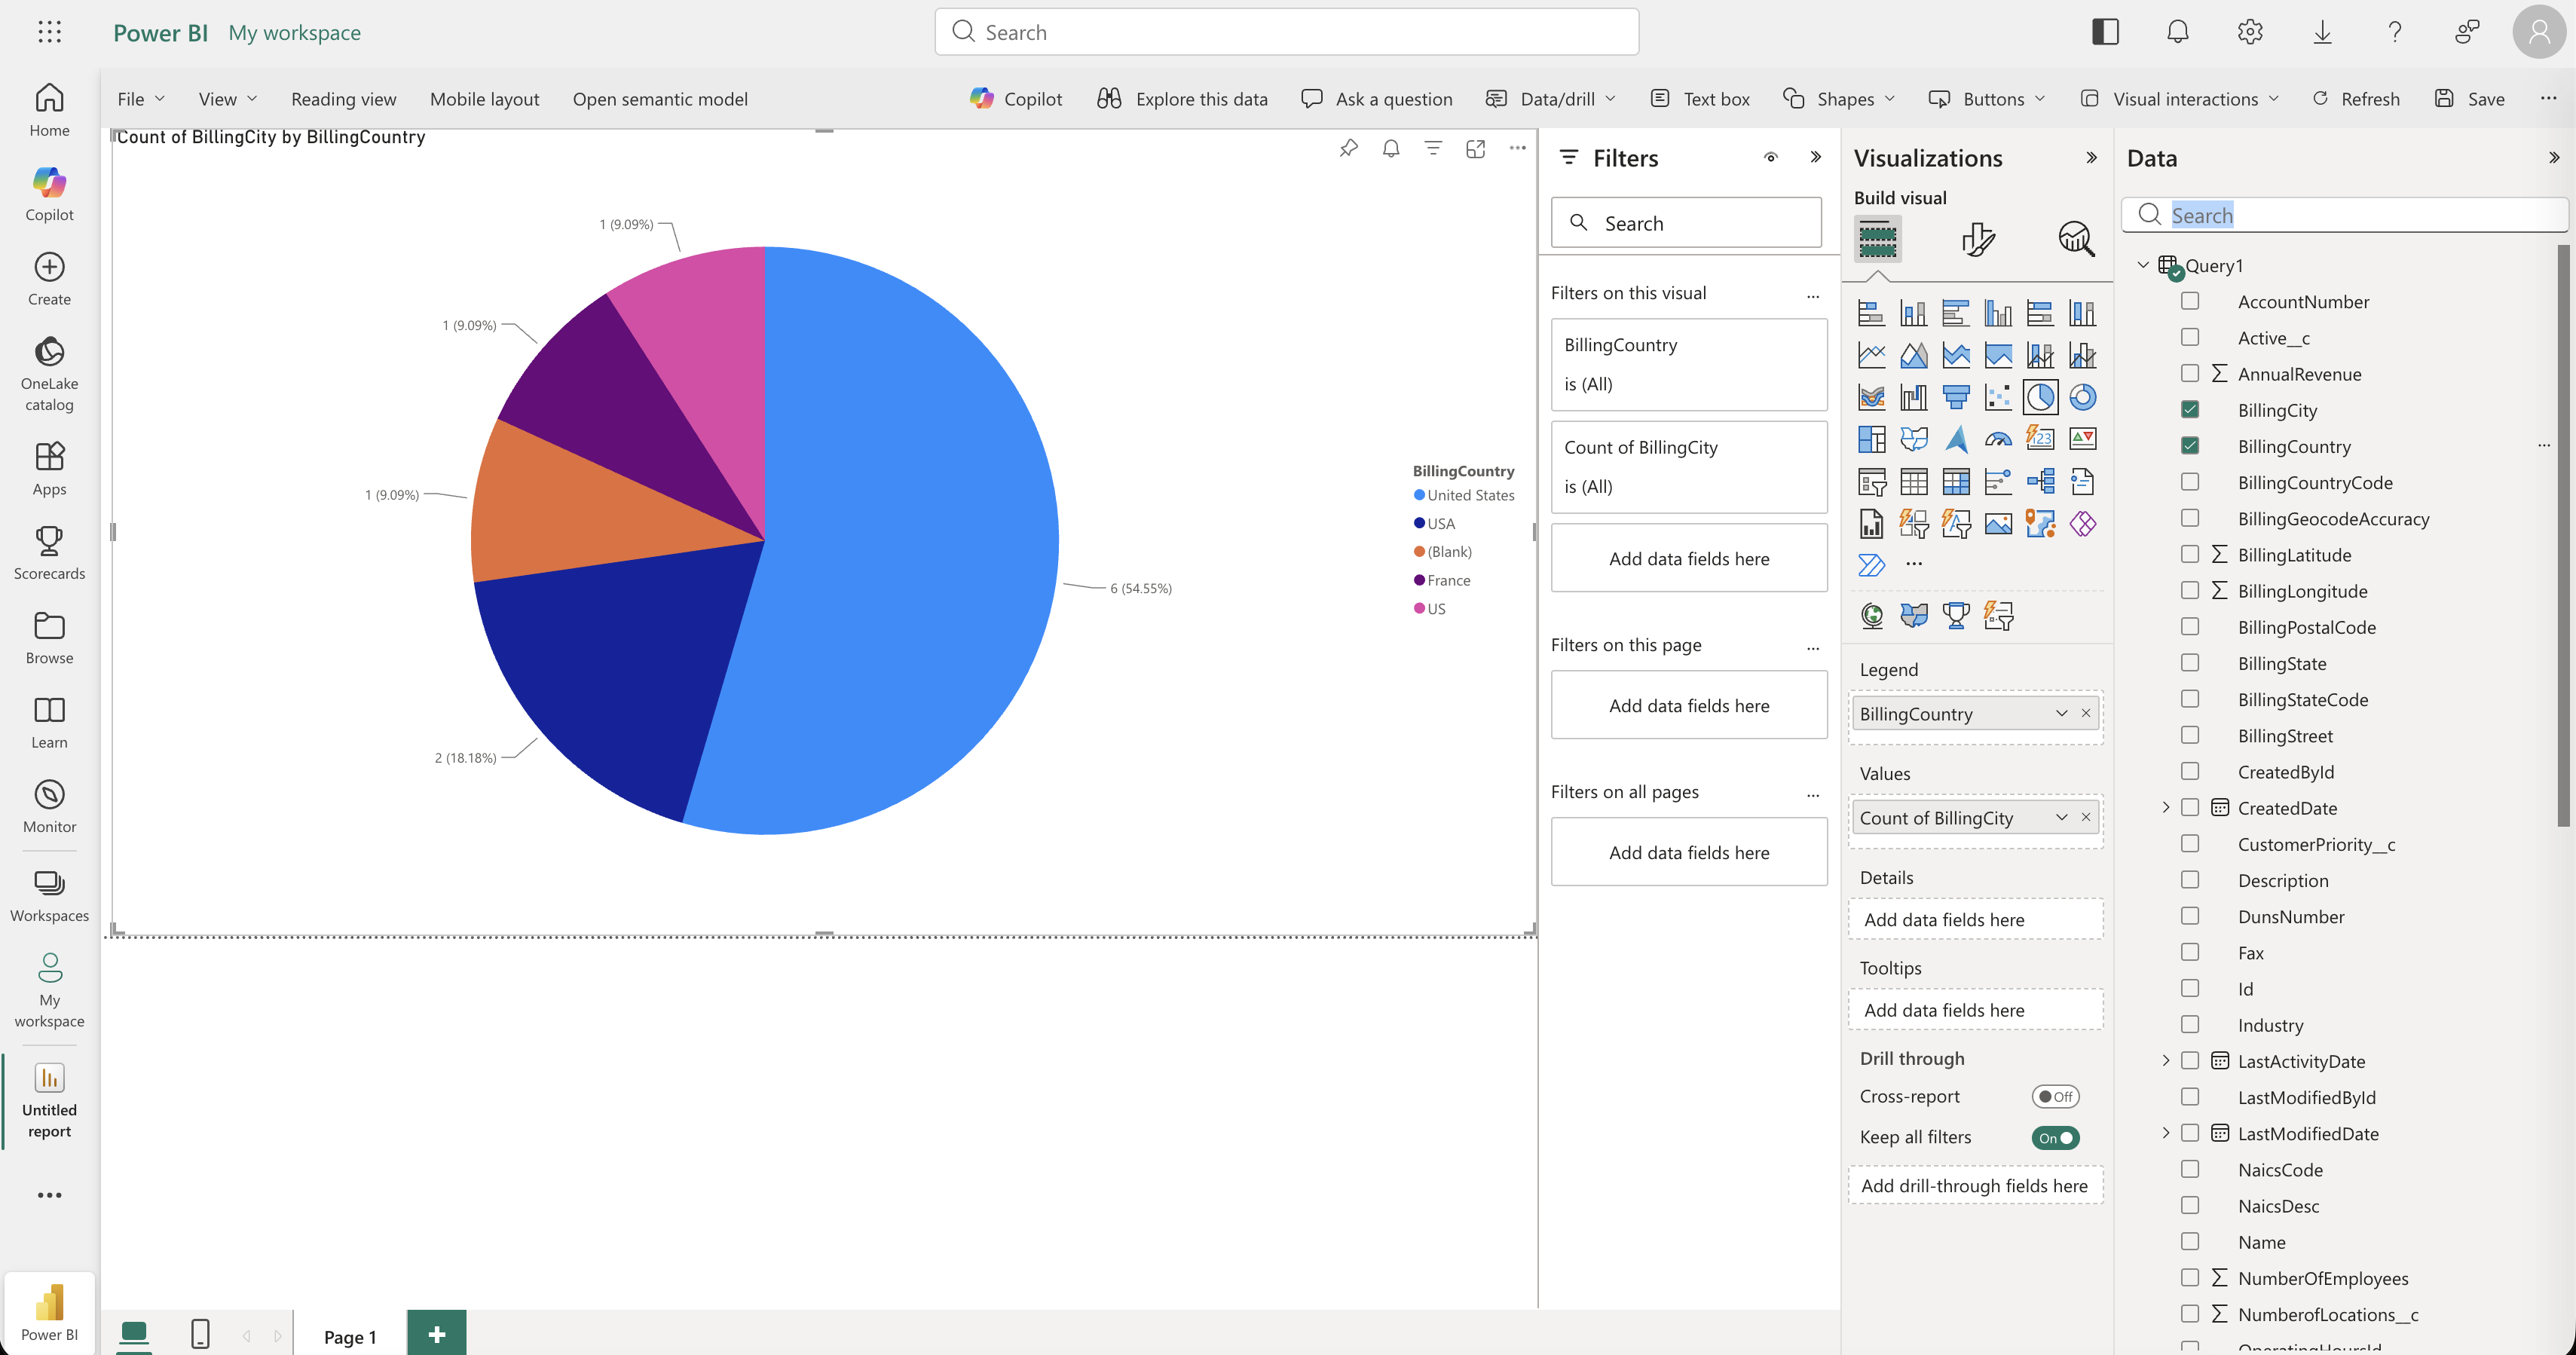
Each widget embeds a Power BI report. Build the report in Power BI on data exported by the connector (see How to Import Salesforce Data into Microsoft Power BI), then publish it to the Power BI service.
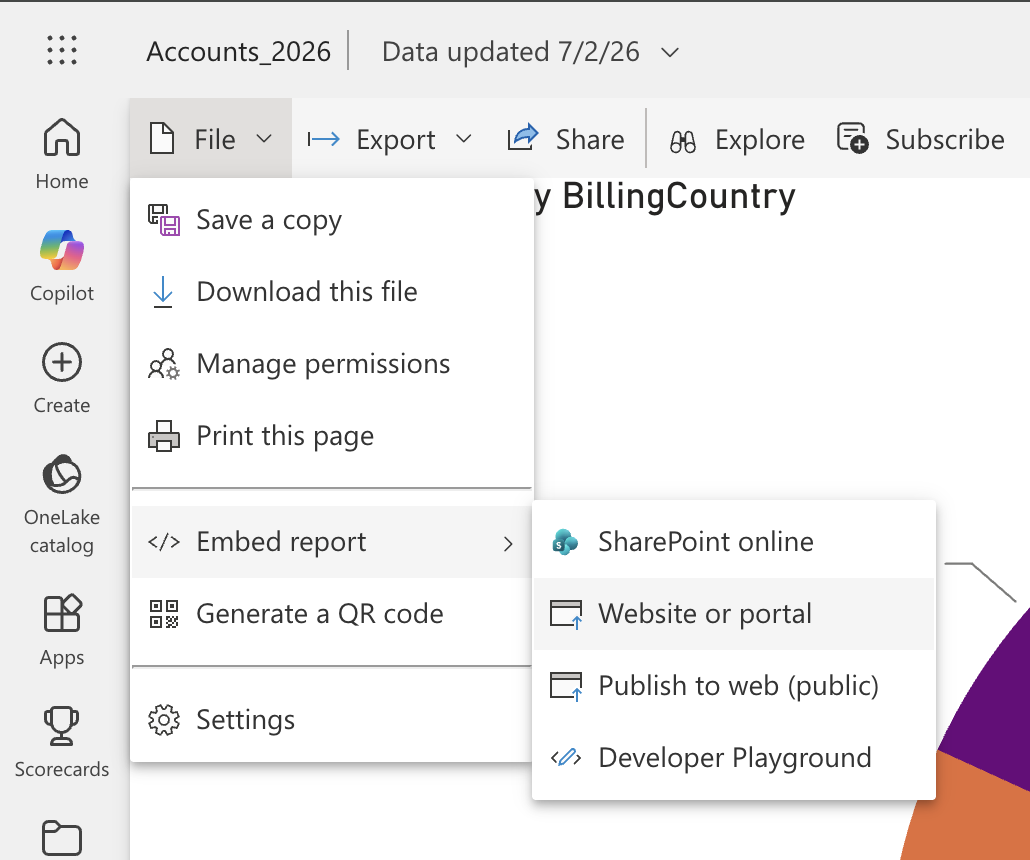
In the published report, open File → Embed report → Website or portal.
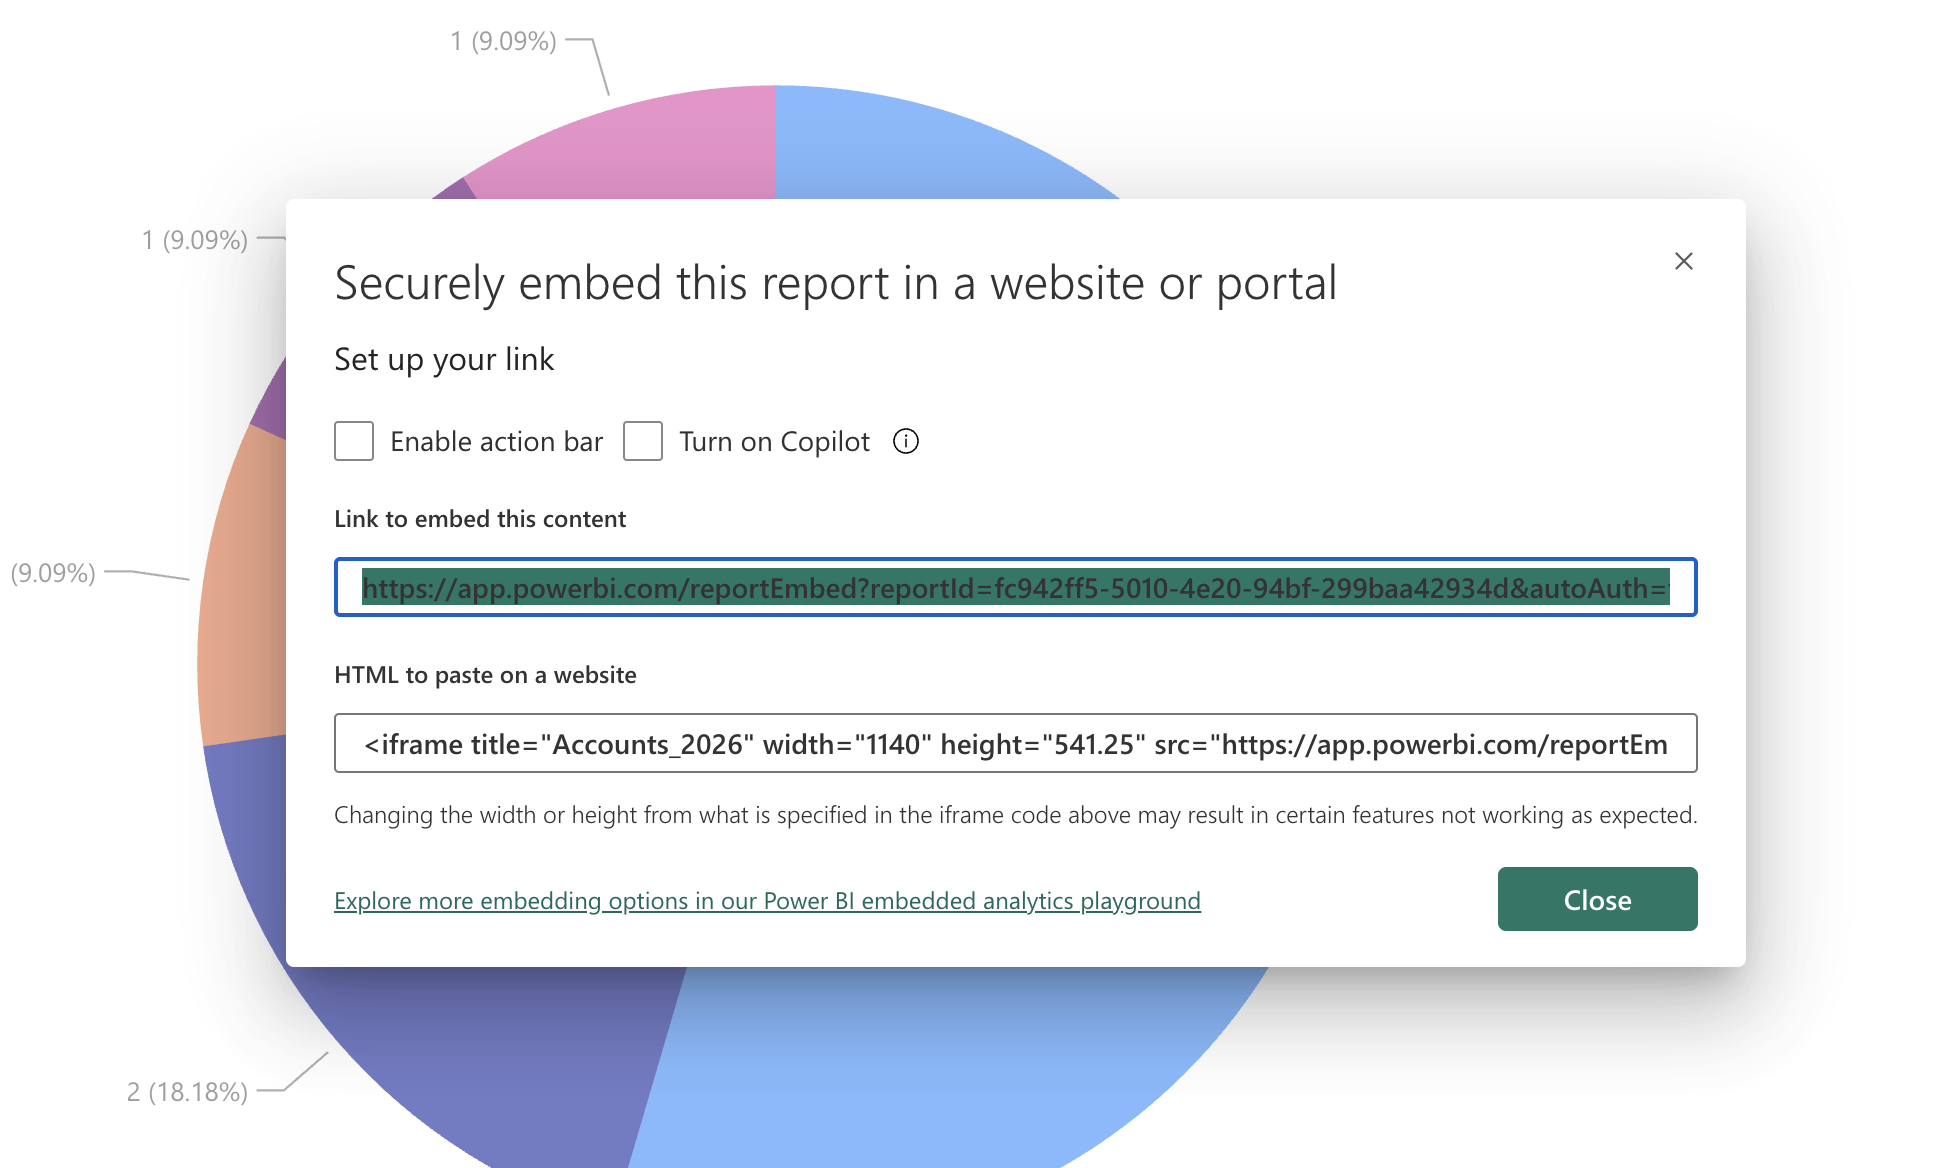
Copy the Link to embed this content — this is the secure embed URL used by the widget.
4. Add a Widget #
Back in the dashboard, click Add widget (or Add the first widget) and fill in:
- Title — the widget header shown on the dashboard
- Embed URL — the secure embed URL copied from Power BI
- Optional display settings: Show filters, Show navigation, Show action bar
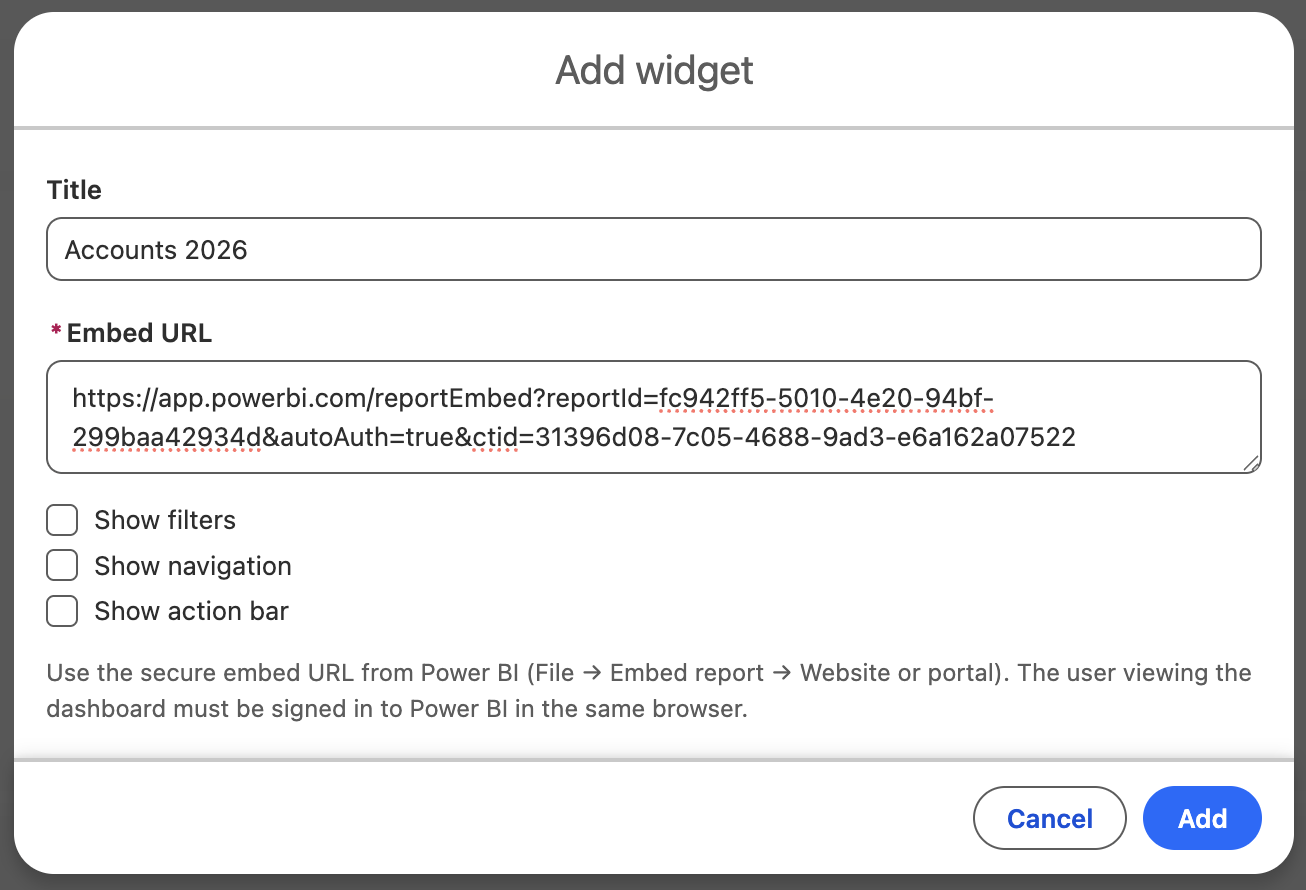
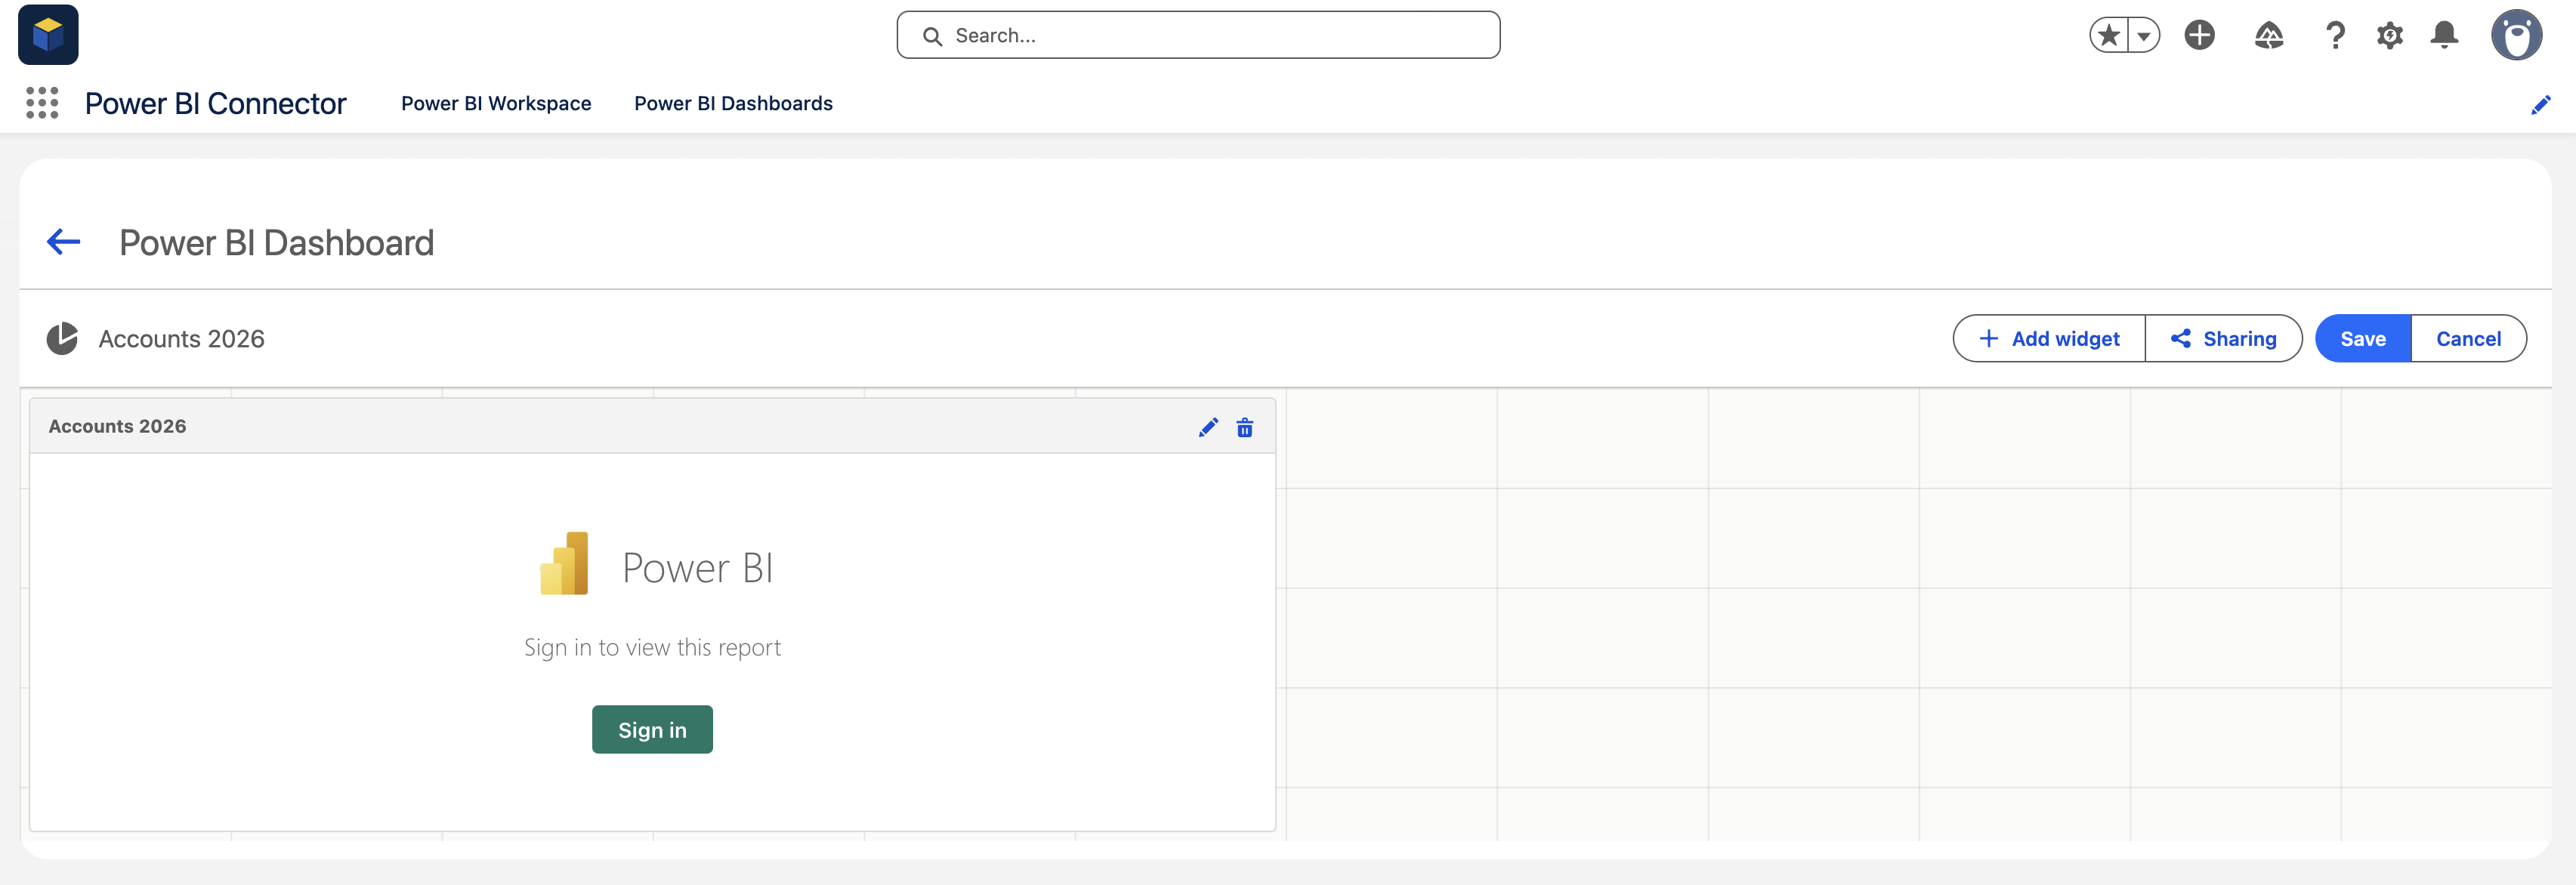
The widget is added to the grid. Power BI content requires authentication: users see a Sign in prompt until they are signed in to Power BI in the same browser.
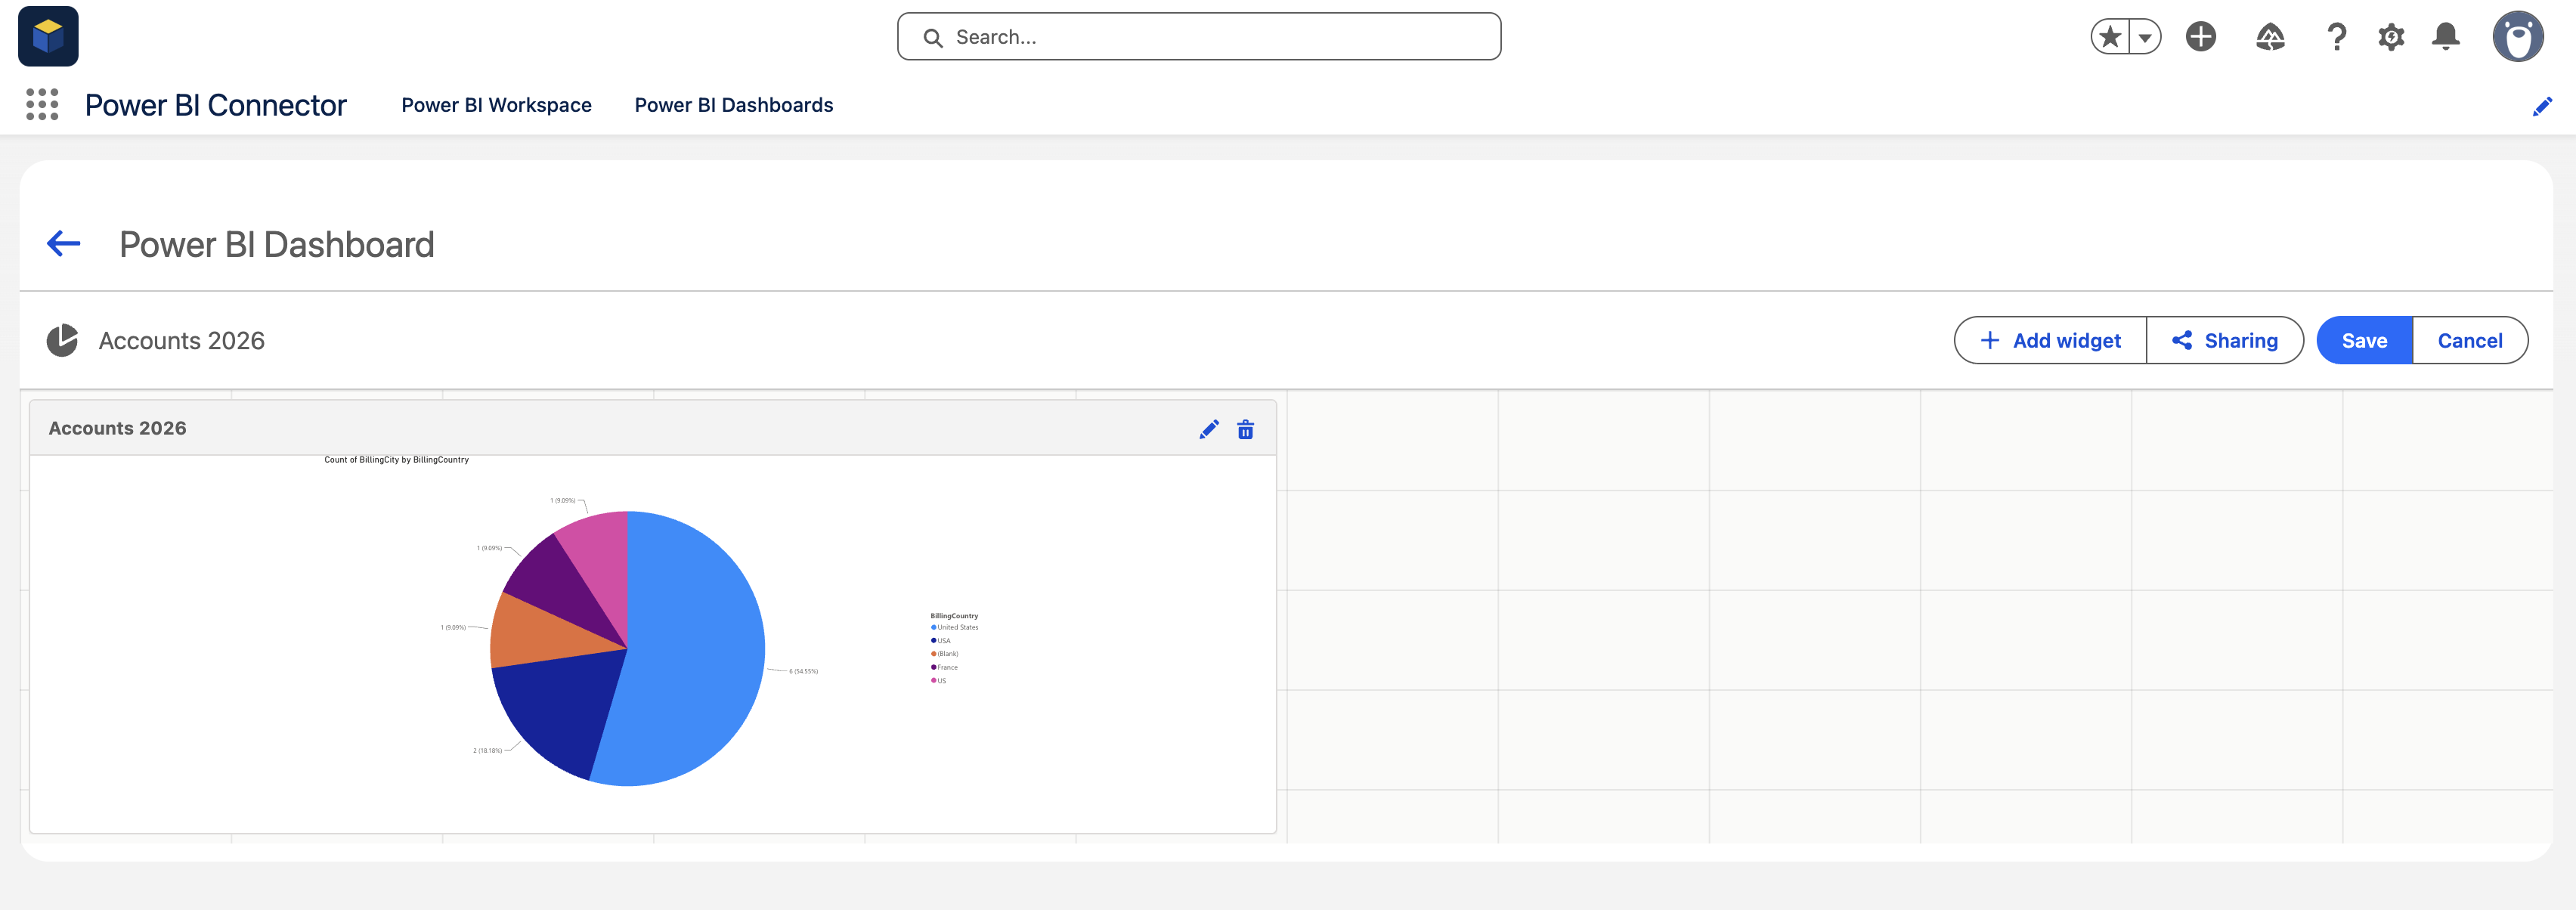
After signing in, the report renders inside the widget.
5. Arrange Widgets and Save #
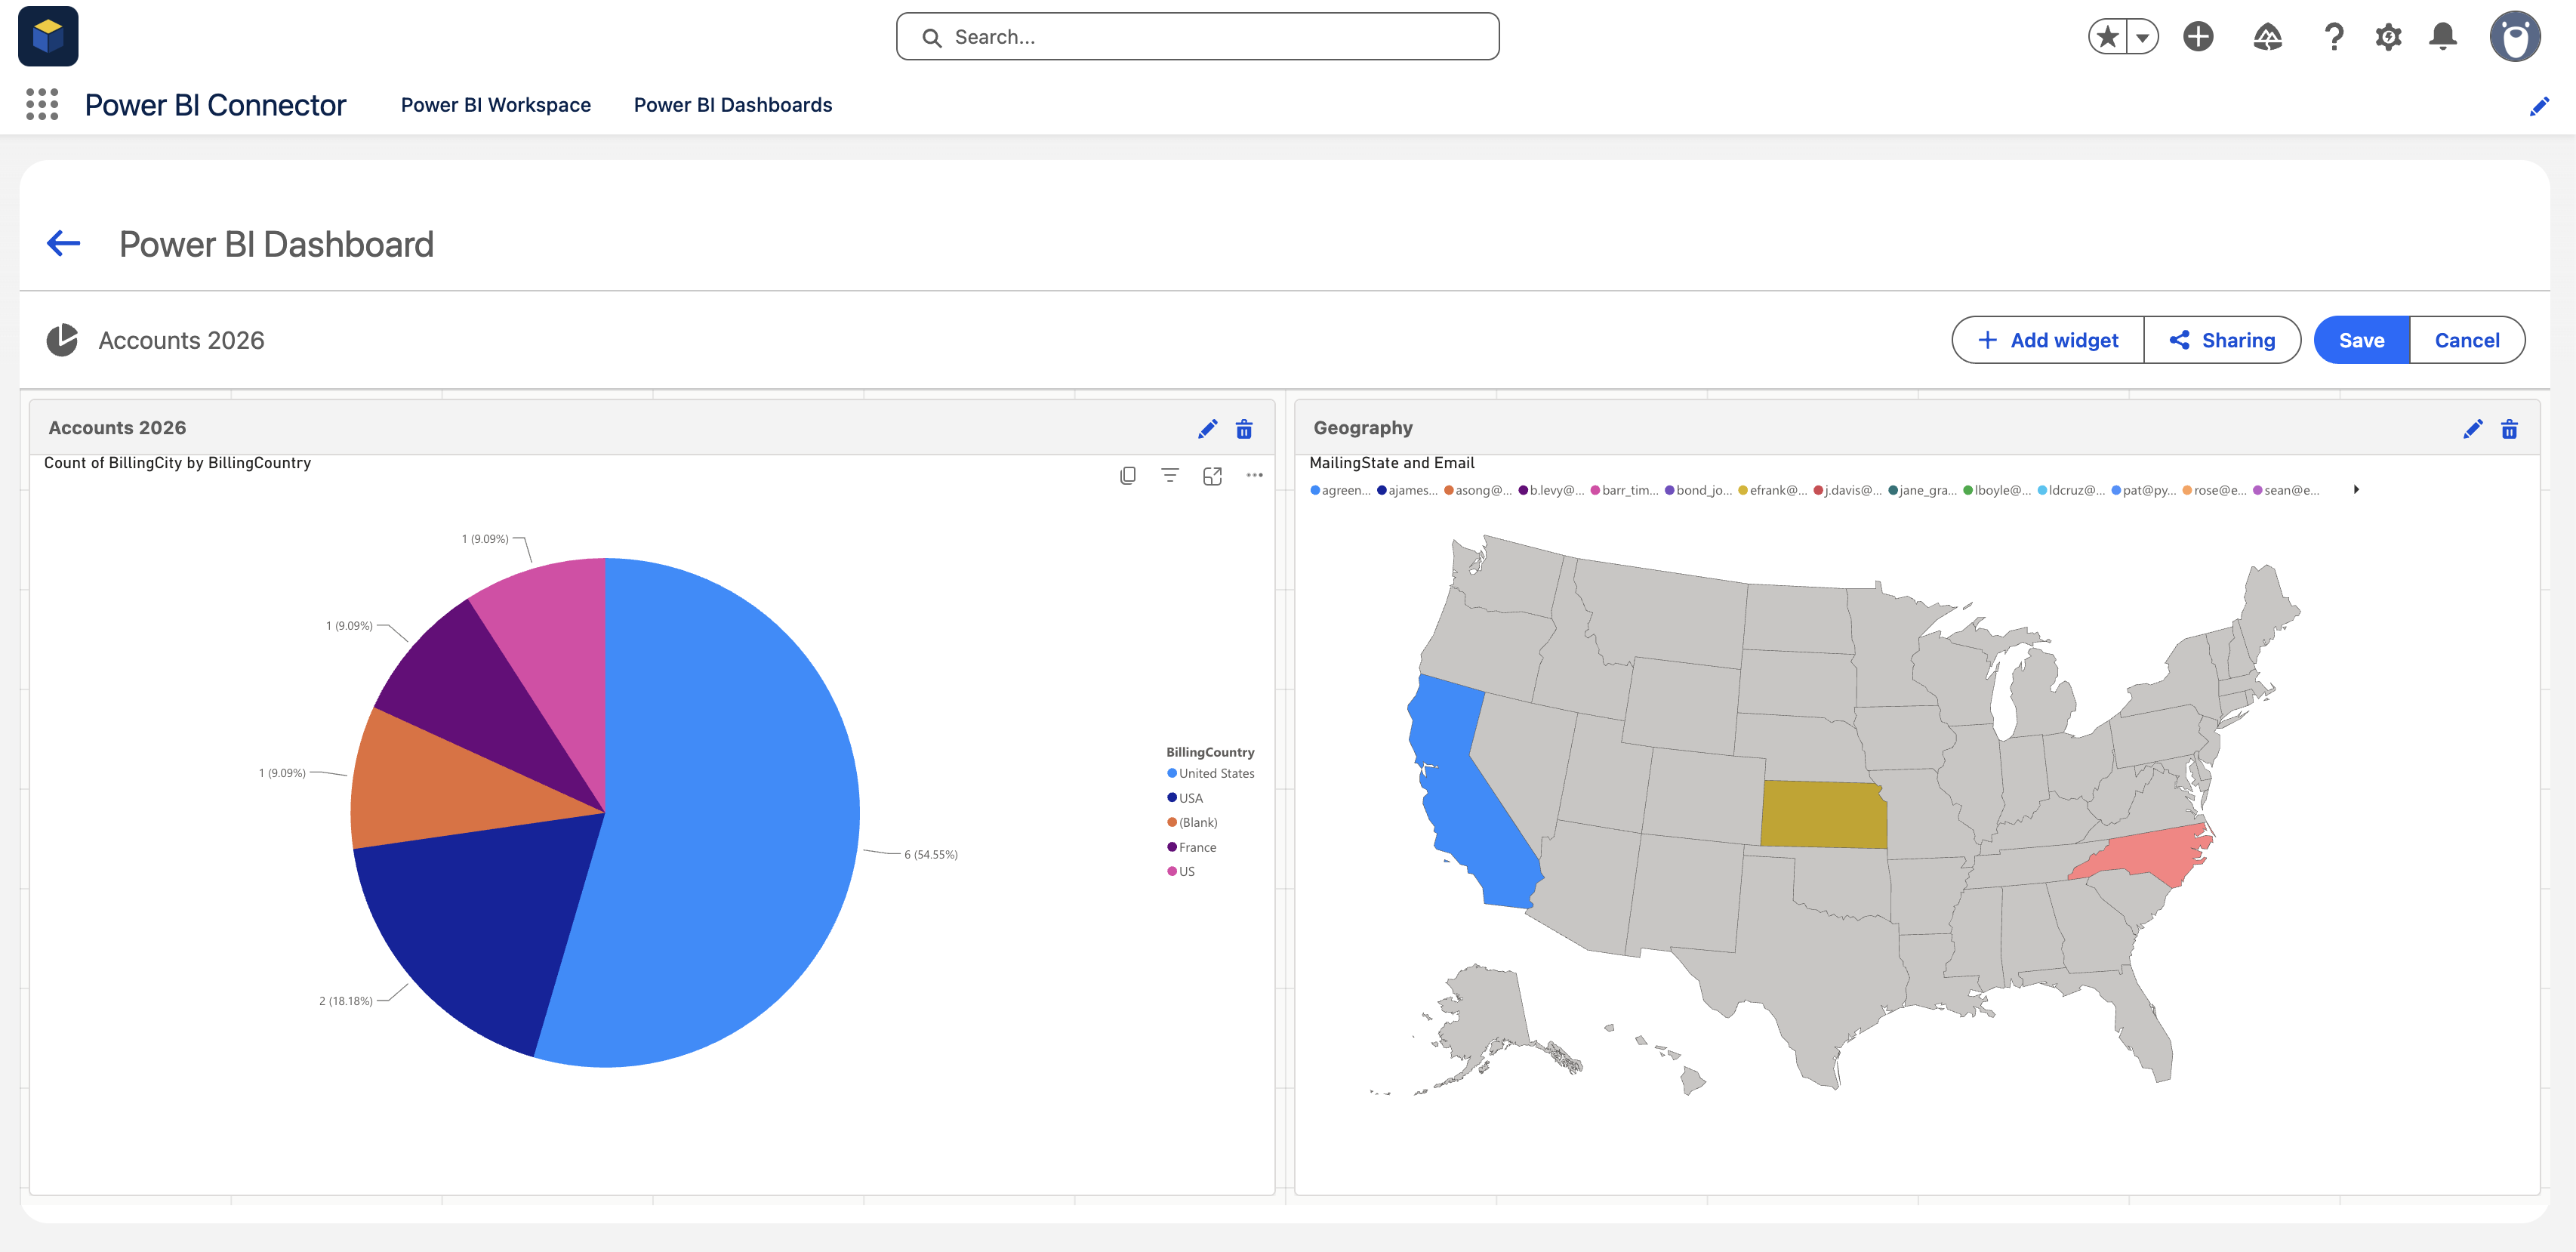
Add as many widgets as you need, drag and resize them on the grid, then click Save.
6. Share the Dashboard #
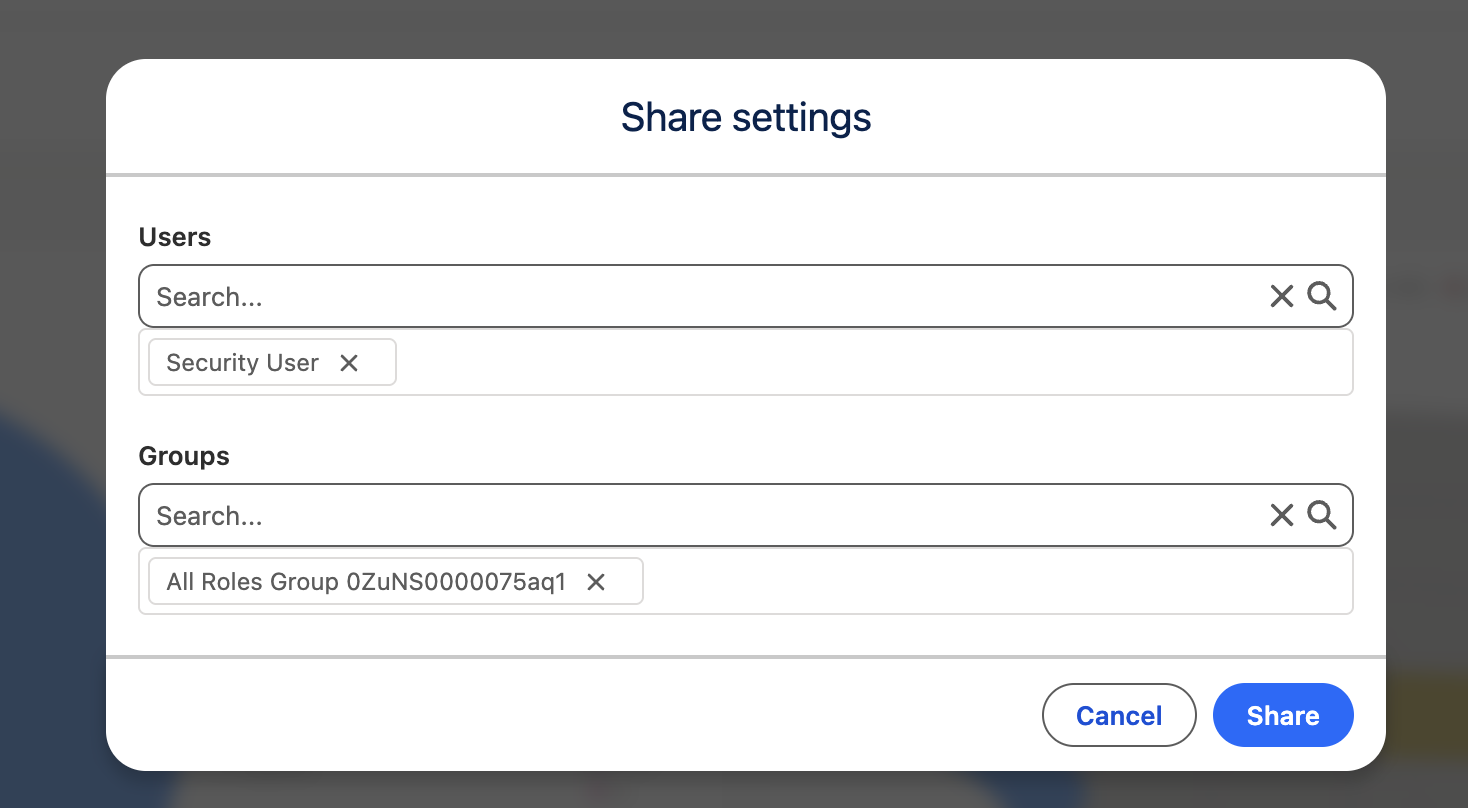
Click Sharing to open Share settings and grant access to Salesforce Users and Groups, then confirm with Share.
7. Track Dashboard Changes #
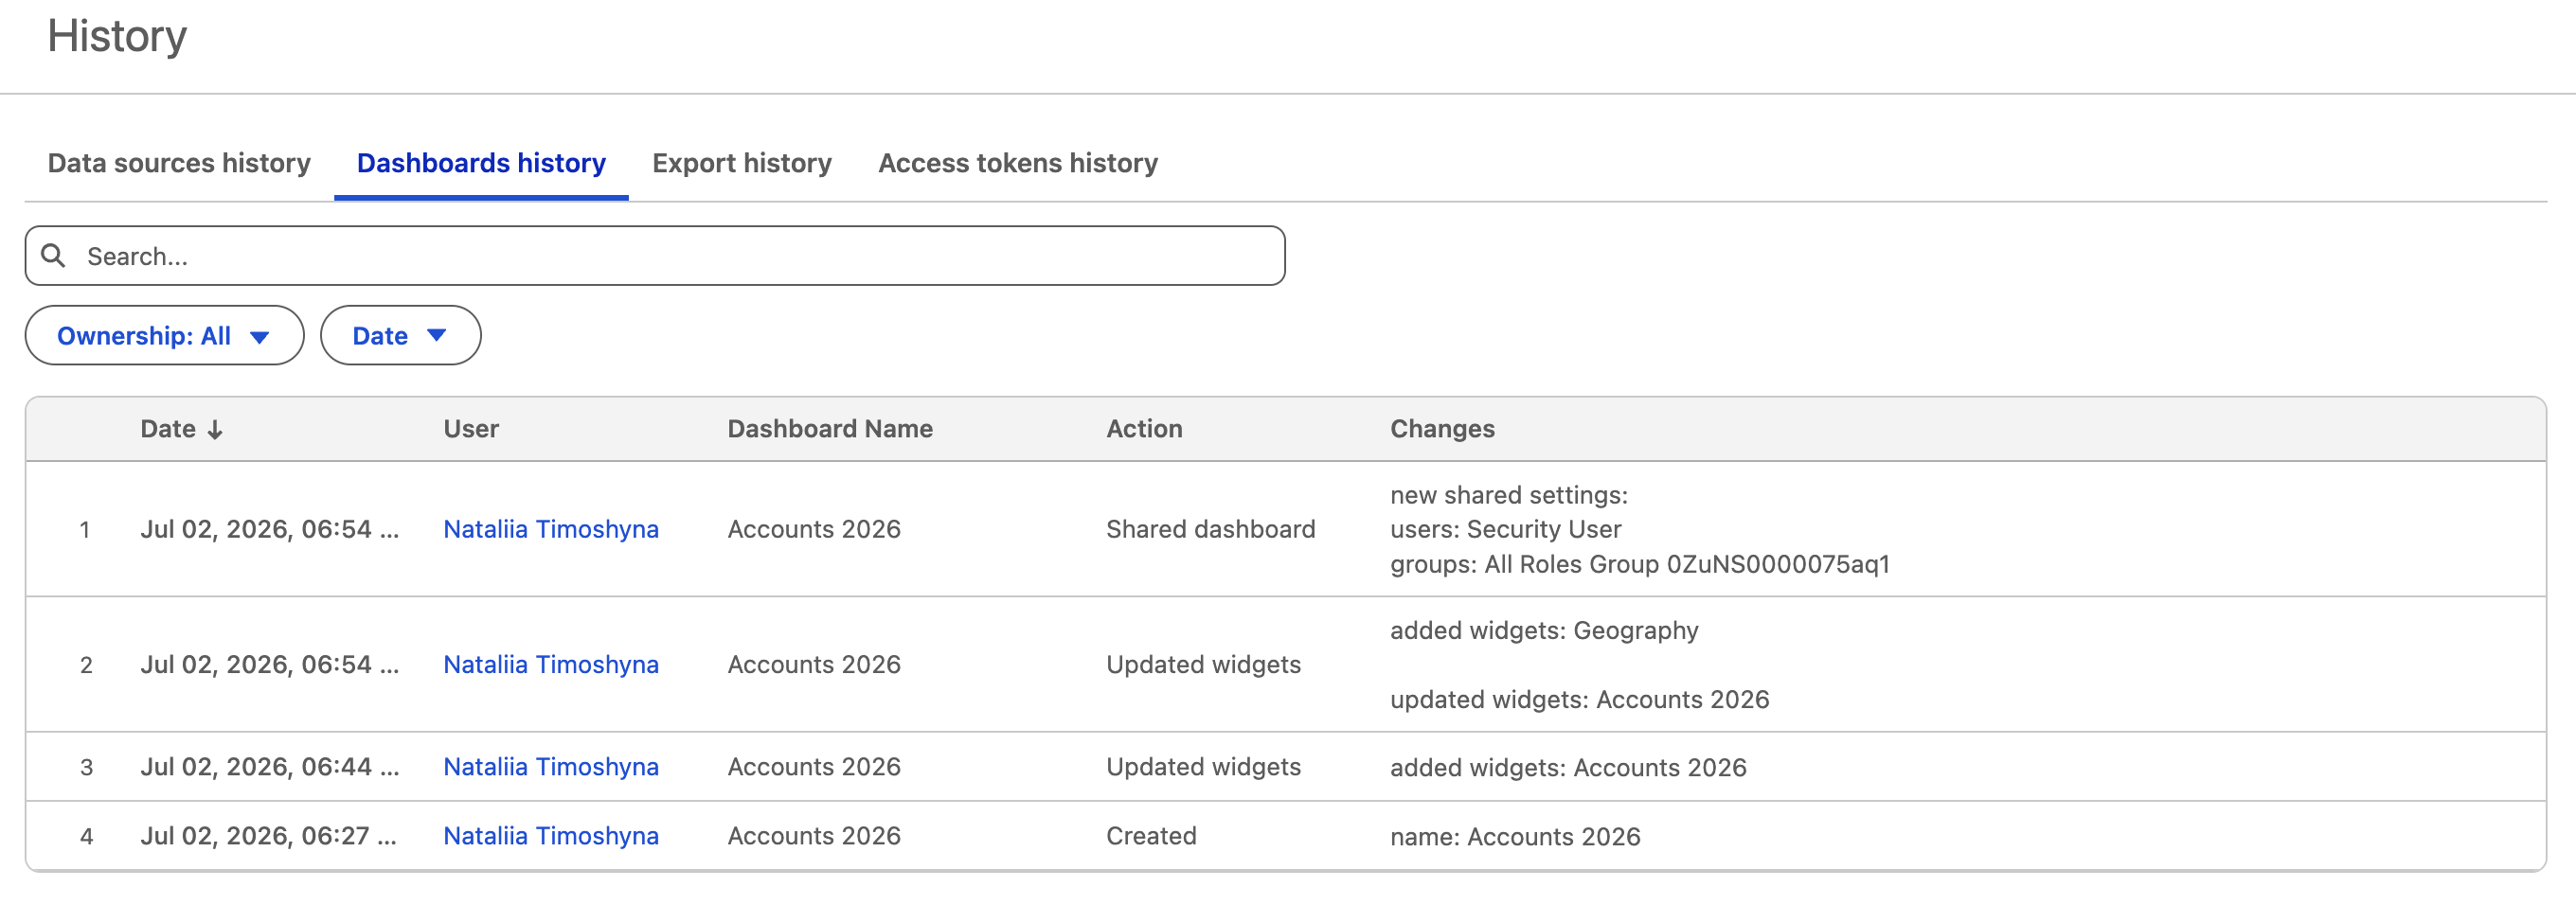
Every dashboard change is recorded under History → Dashboards history: who made the change, when, and what was modified.
💡 Notes #
- Access is enforced by Power BI authorization: only users who are allowed to view a report in Power BI itself can view it in Power BI Connector for Salesforce. Viewers must be signed in to Power BI in the same browser
- Use the secure embed URL from File → Embed report → Website or portal — not a public “Publish to web” link — to keep access controlled
- Dashboards are built on your data sources — see How to Create Data Source


