The shortest path from zero to a Power BI report fed by your HubSpot data. Four steps, each linked to its long-form guide if you want more detail.
This guide assumes the connector is already installed in your HubSpot portal. If not, follow Installation Guide first.
Step 1 — Create an access token #
Power BI authenticates to your data source with HTTP Basic auth: your username plus a personal access token. Create one now so it’s ready for step 3.
- In the connector, open Access Tokens in the left nav.
- Click Create token. Give it a memorable label, for example Power BI Desktop — laptop.
- Optionally set an expiry date.
- Confirm. The token value is shown exactly once. Click Copy and save it somewhere safe (a password manager works).
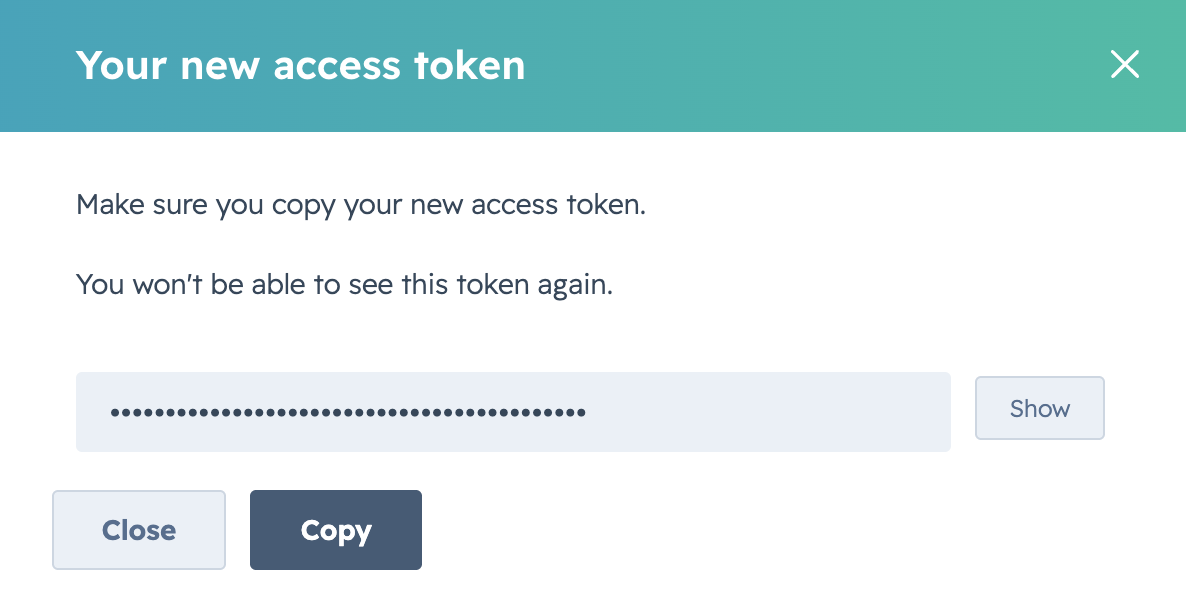
Full guide: Create an Access Token.
Step 2 — Create a data source #
A data source bundles a selection of HubSpot objects and properties into a single OData URL that Power BI can read.
- Open Data Sources in the connector’s left nav, then click Create data source.
- Give it a name (for example, Sales Pipeline) and an optional description.
- In the object tree, expand a HubSpot object (start simple — Deals is a good first pick) and tick the properties you want in your report.
- Optionally repeat for additional objects (Companies, Contacts) to build a multi-object data source.
- Click Save.
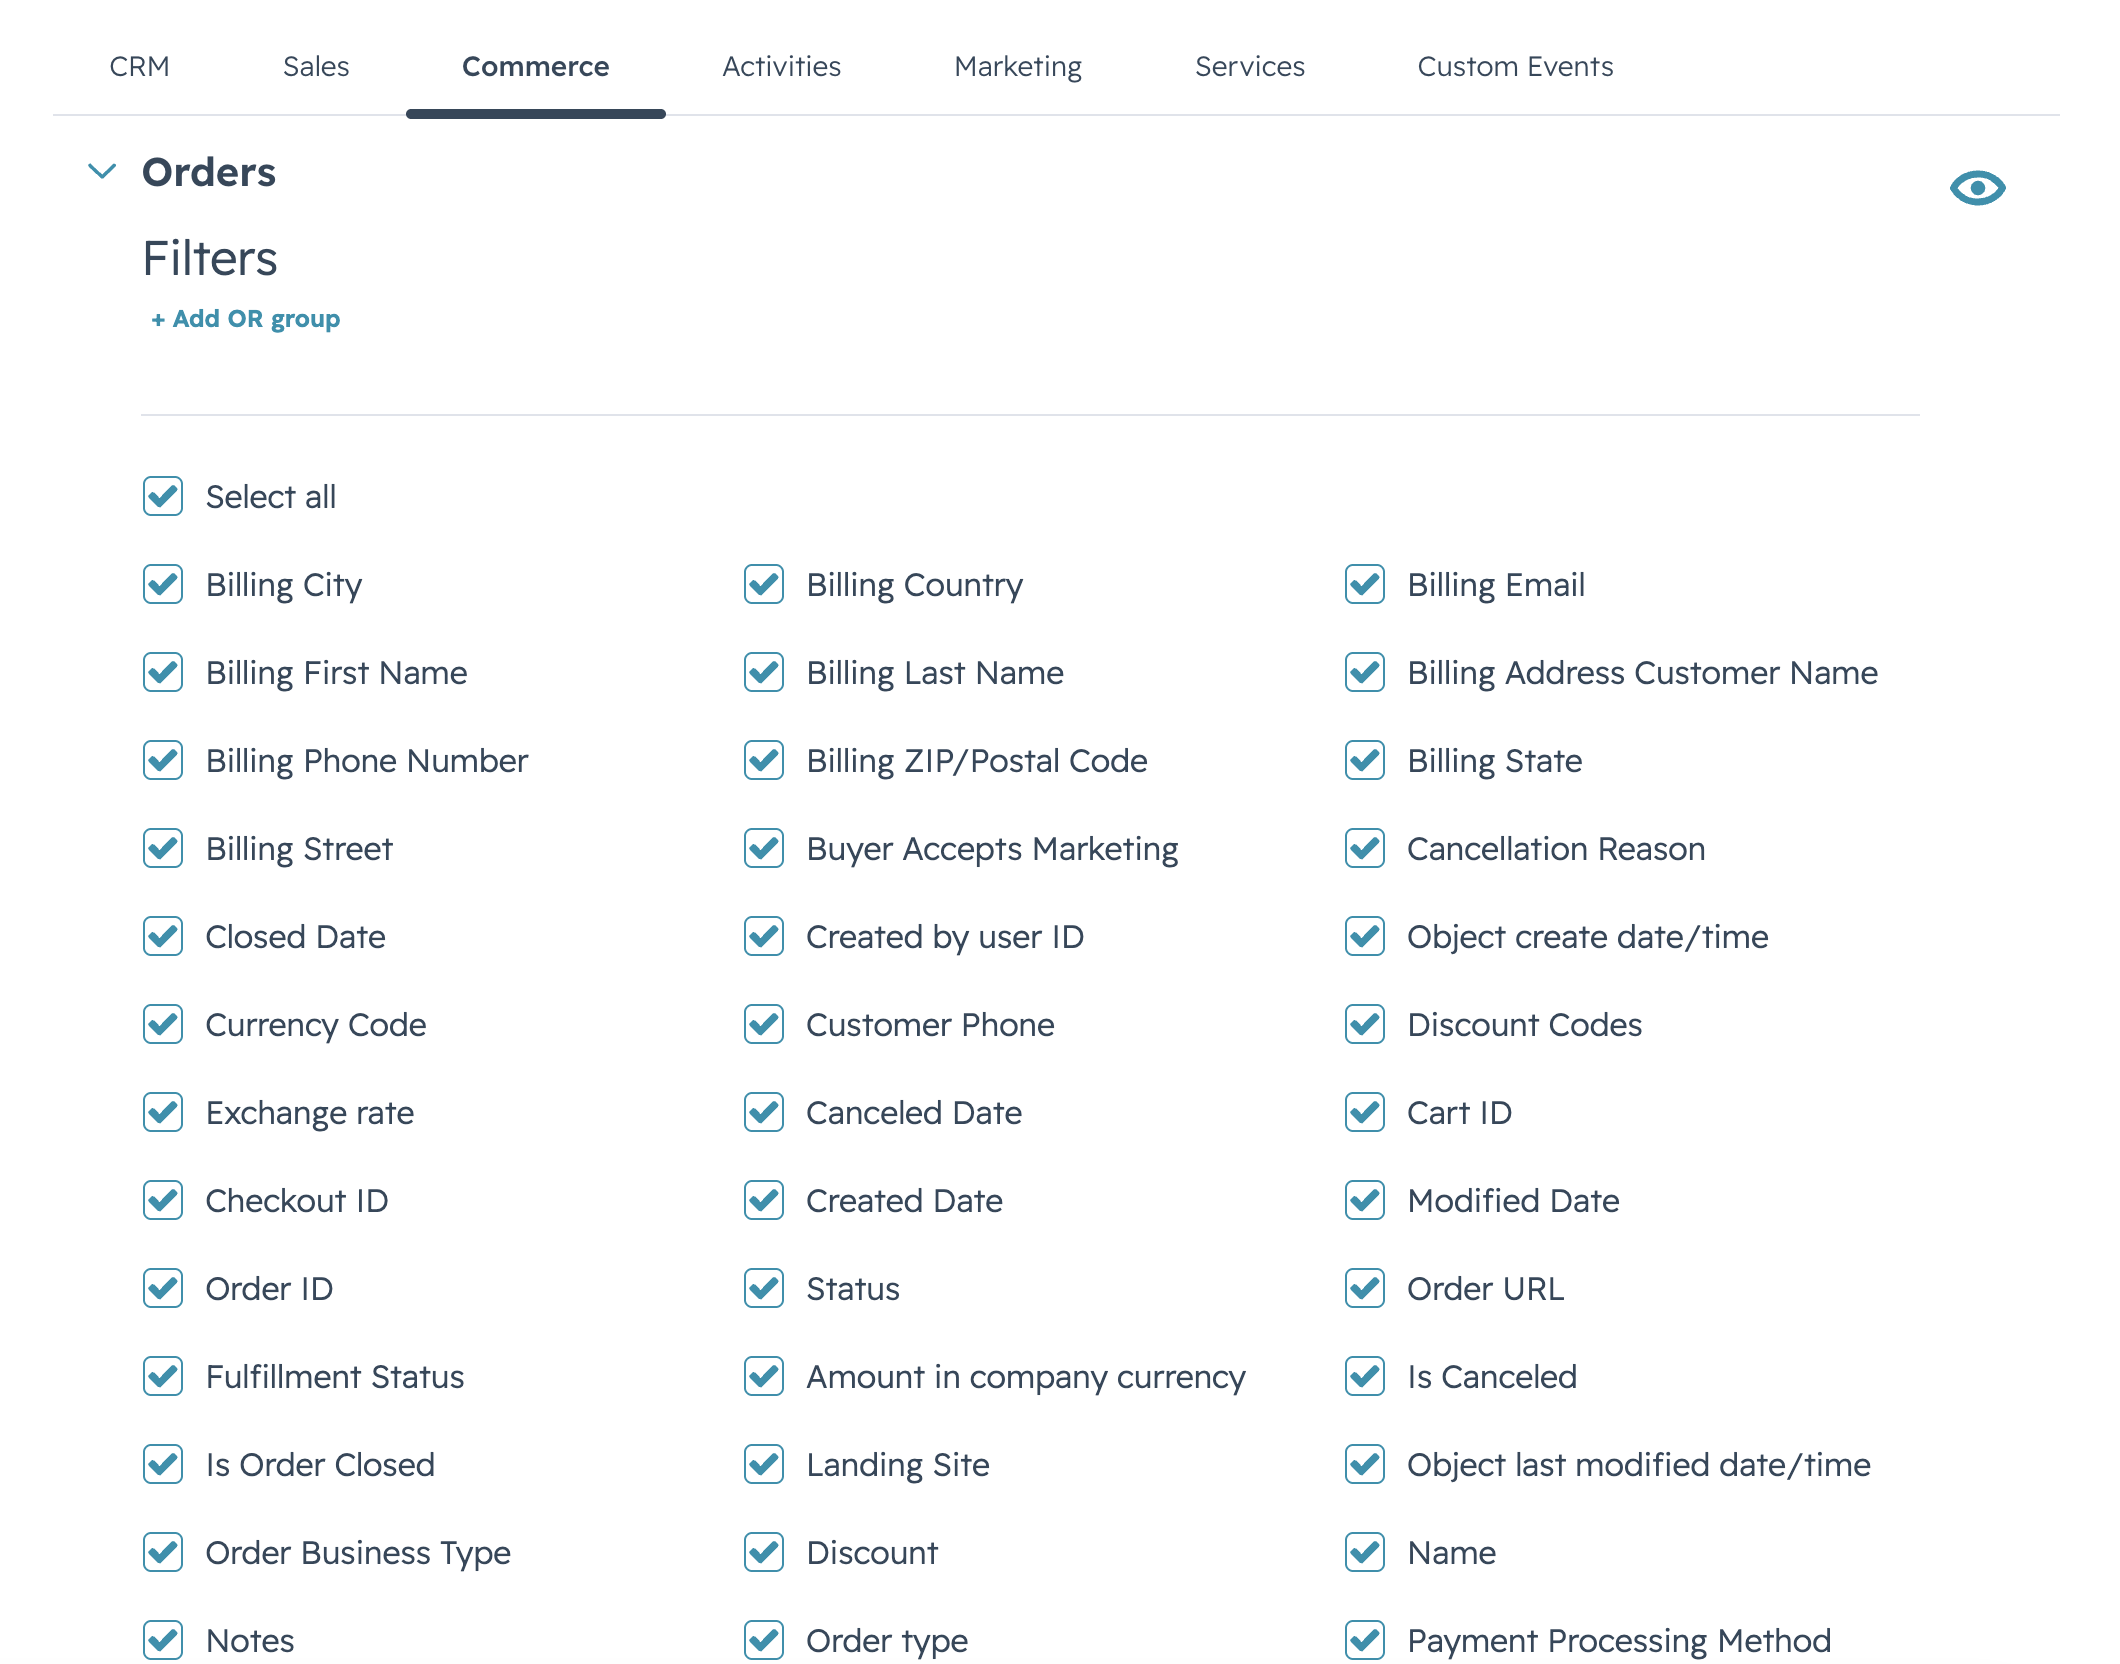
Full guide: Create a Data Source.
Step 3 — Connect Power BI Desktop #
- Back on the Data Sources page, copy your new data source’s OData URL.
- Open Power BI Desktop. Select Get data → OData feed.
- Paste the URL. When prompted for credentials, choose Basic. Enter your connector username + the access token from step 1 as the password. Confirm.
- Power BI fetches the metadata, lists the tables it discovered, and loads them into the model.
Full guide: Connect Power BI Desktop.
Step 4 — Build your report #
From here it’s standard Power BI. Drag fields onto the canvas, build visuals, save the .pbix.
Want to publish the report to the Power BI service and have it refresh on a schedule? See Schedule Refresh in Power BI Service. You’ll typically create a second access token labelled Power BI service refresh so you can revoke it independently of your laptop token.


