The connector offers three ways to view an ERD, at three different levels of zoom. Pick the one that matches the question you’re trying to answer:
- From a data source — scoped to just the objects in one data source. Best for verifying a specific selection before you hook Power BI up to it.
- Per-module ERD — the standard schema for one HubSpot module (e.g. CRM), independent of which data source you have. Best for understanding how a whole module hangs together.
- Full ERD (full schema) — every object the connector works with in this portal, including your custom objects and custom events. Best when you genuinely need a bird’s-eye view of everything.
From a data source #
The data-source ERD is scoped to just the objects in one data source. Use it to verify a specific data source’s shape before you build a Power BI model on top of it.
Two entry points:
- From the create or edit form, select Preview ERD in the footer. A modal opens with the diagram for the currently-selected objects.
- From the Data Sources list, open the row’s Actions menu and choose Preview ERD. This opens the same dialog with the data source’s saved selection.
What the diagram shows:
- Each box is an object from the selection. Objects the connector reads as parents of selected child objects are shown too, so the diagram stays self-contained.
- Lines between boxes are associations declared by HubSpot between the selected objects, with standard cardinality markers (1, *, 0..1).
- Green boxes are junction tables. The connector auto-creates them for most associations so your Power BI model survives if a HubSpot admin later changes an association’s cardinality — Power BI can’t refresh a report that suddenly hits a many-to-many, but the junction keeps it a clean one-to-many.
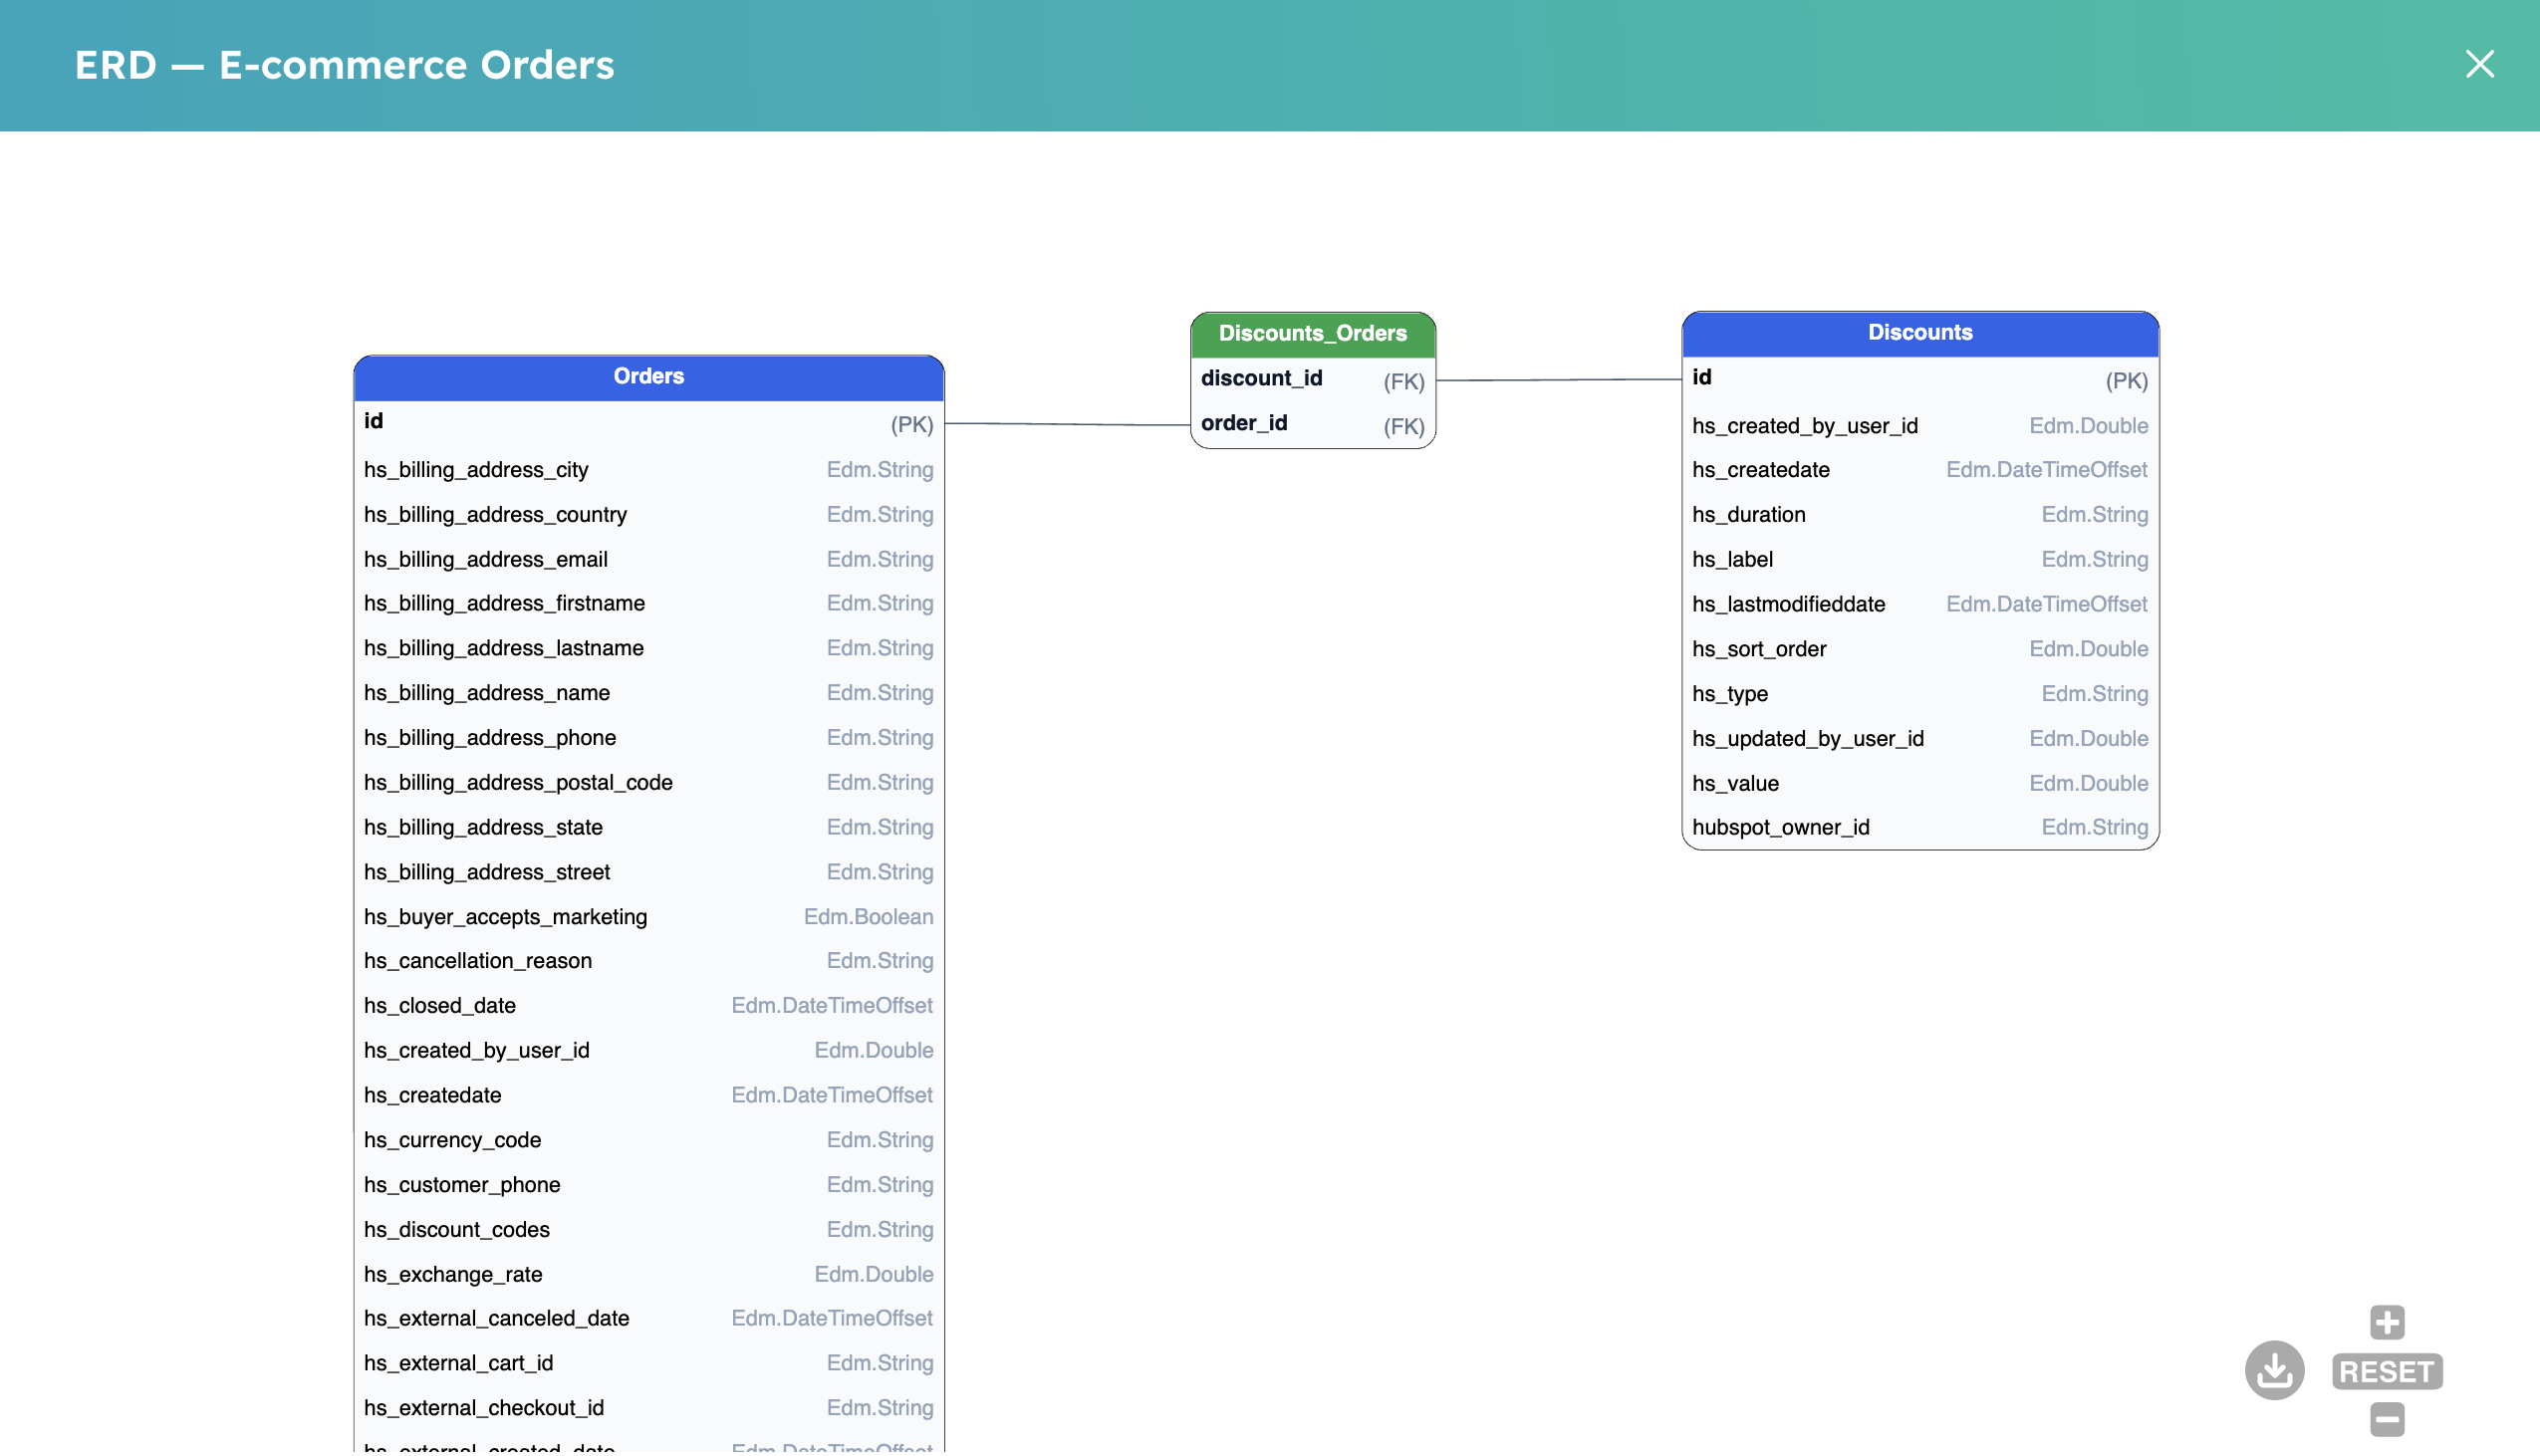
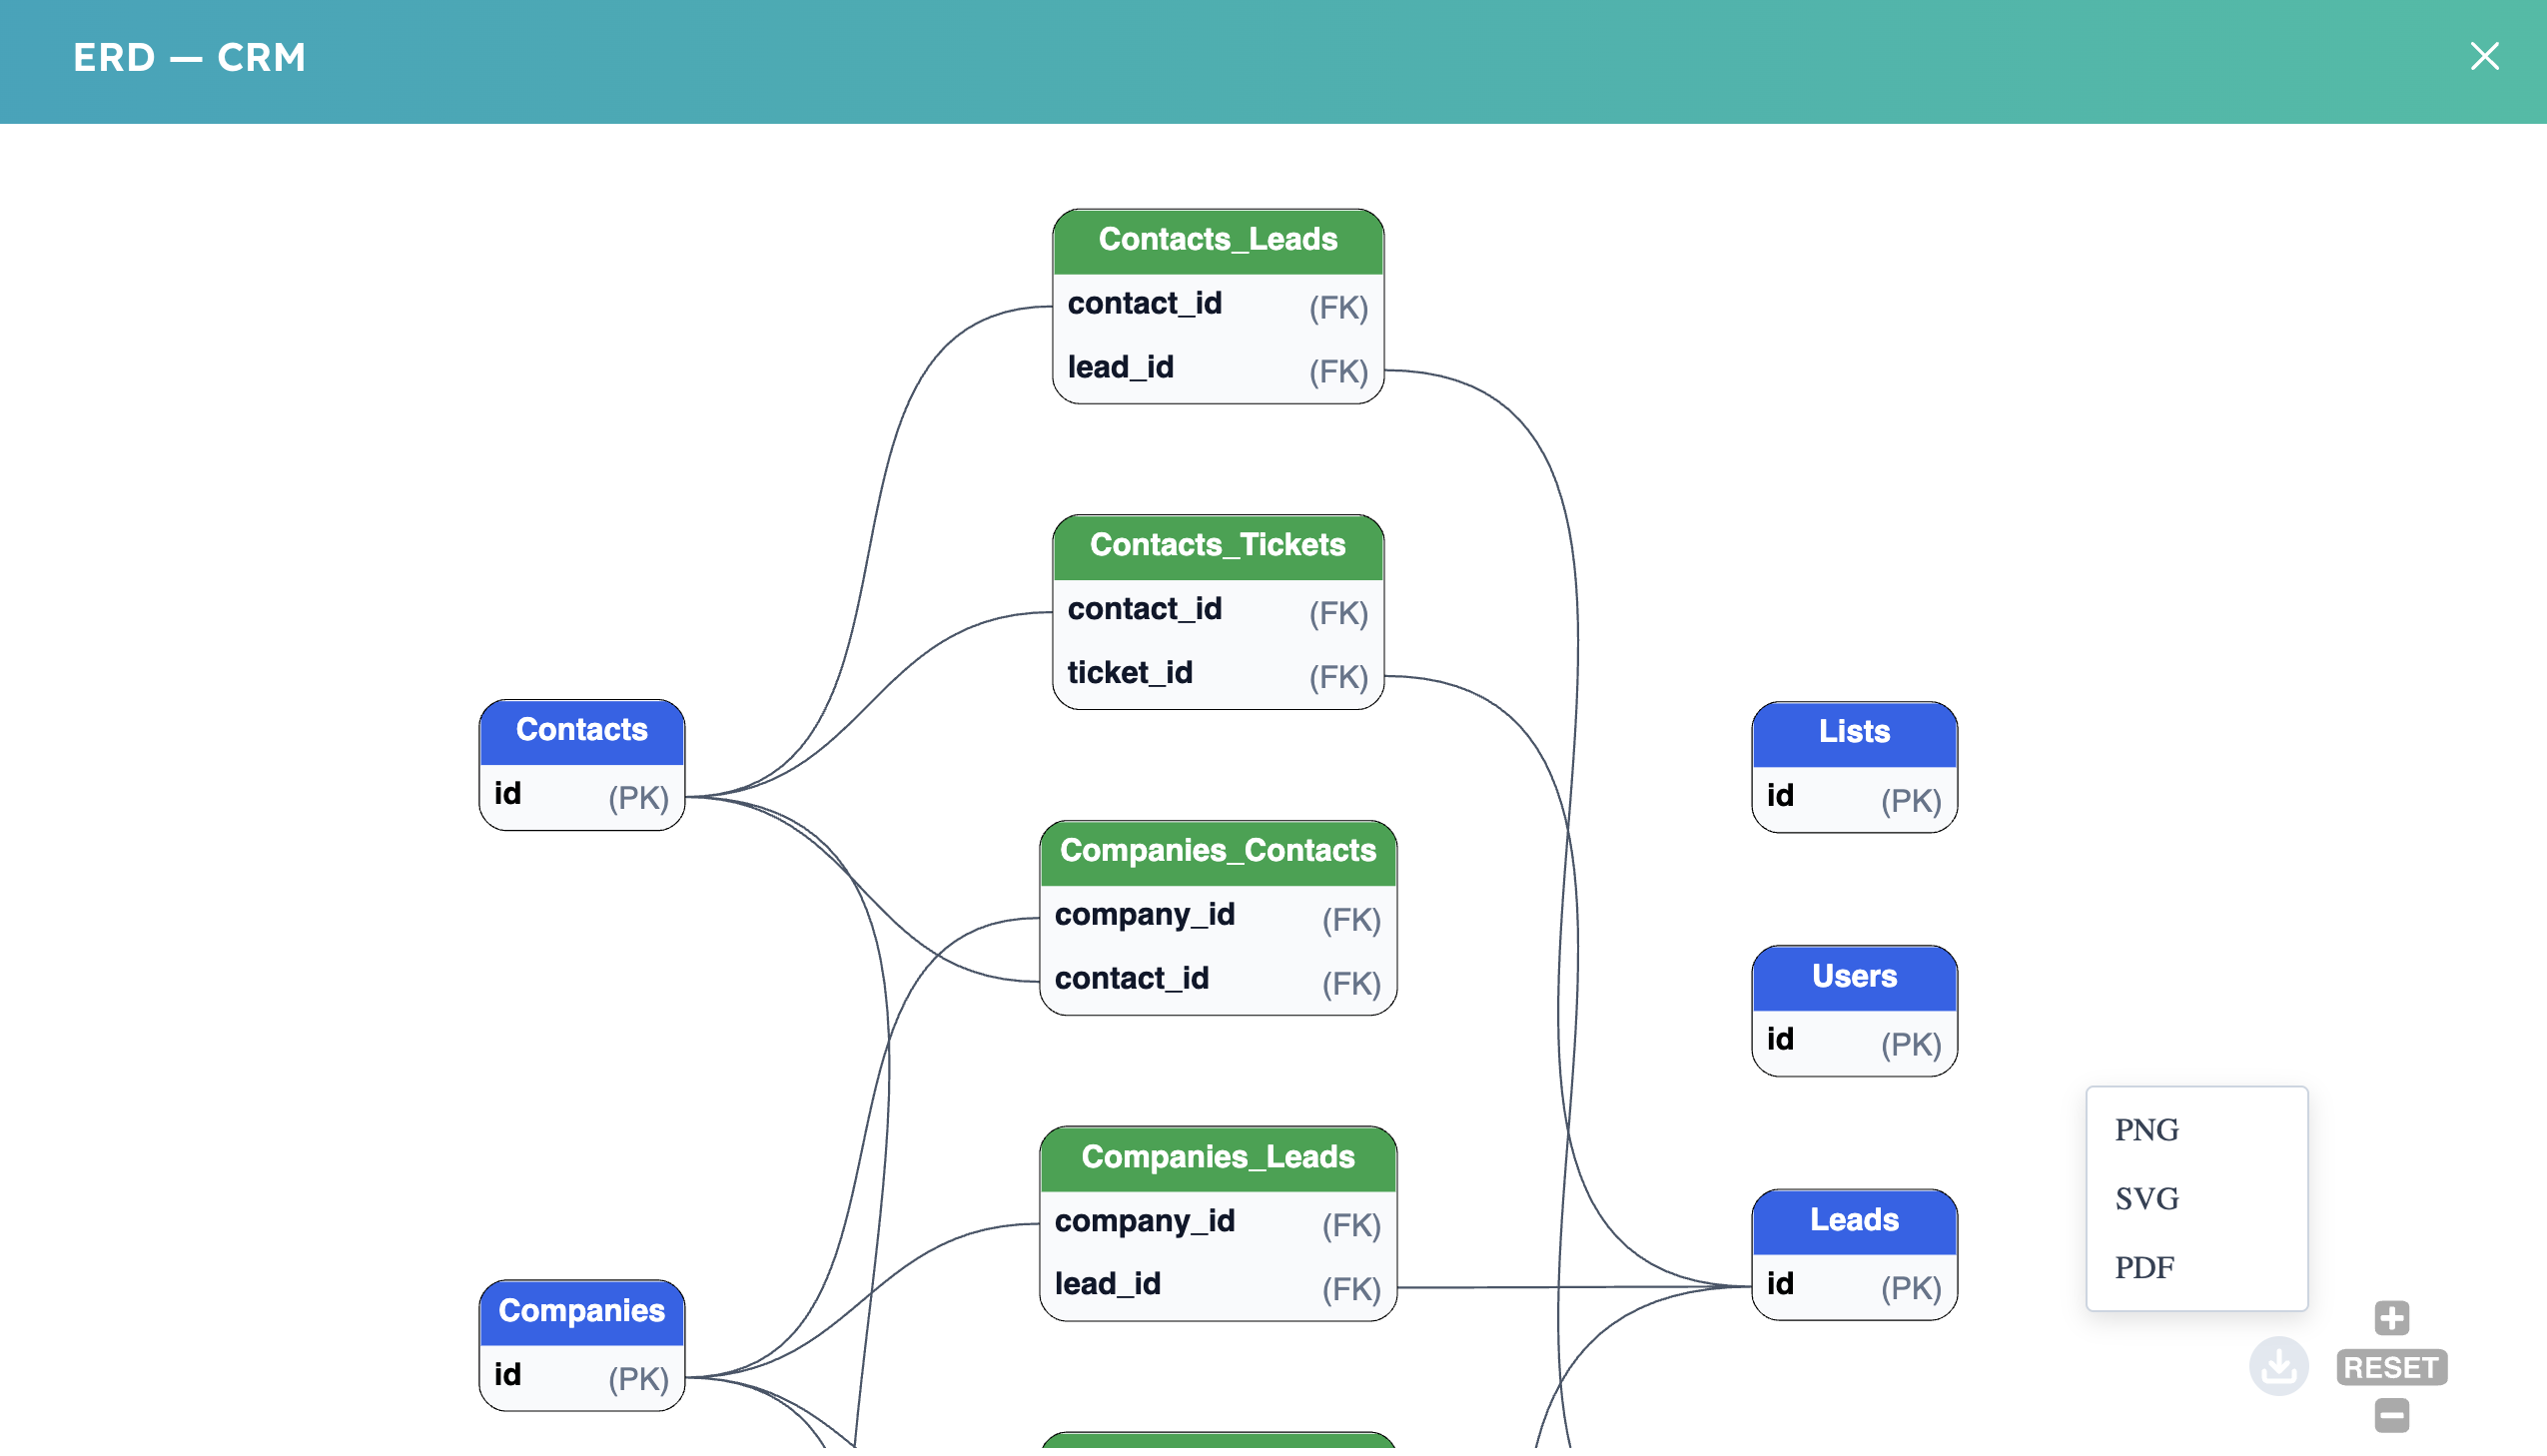
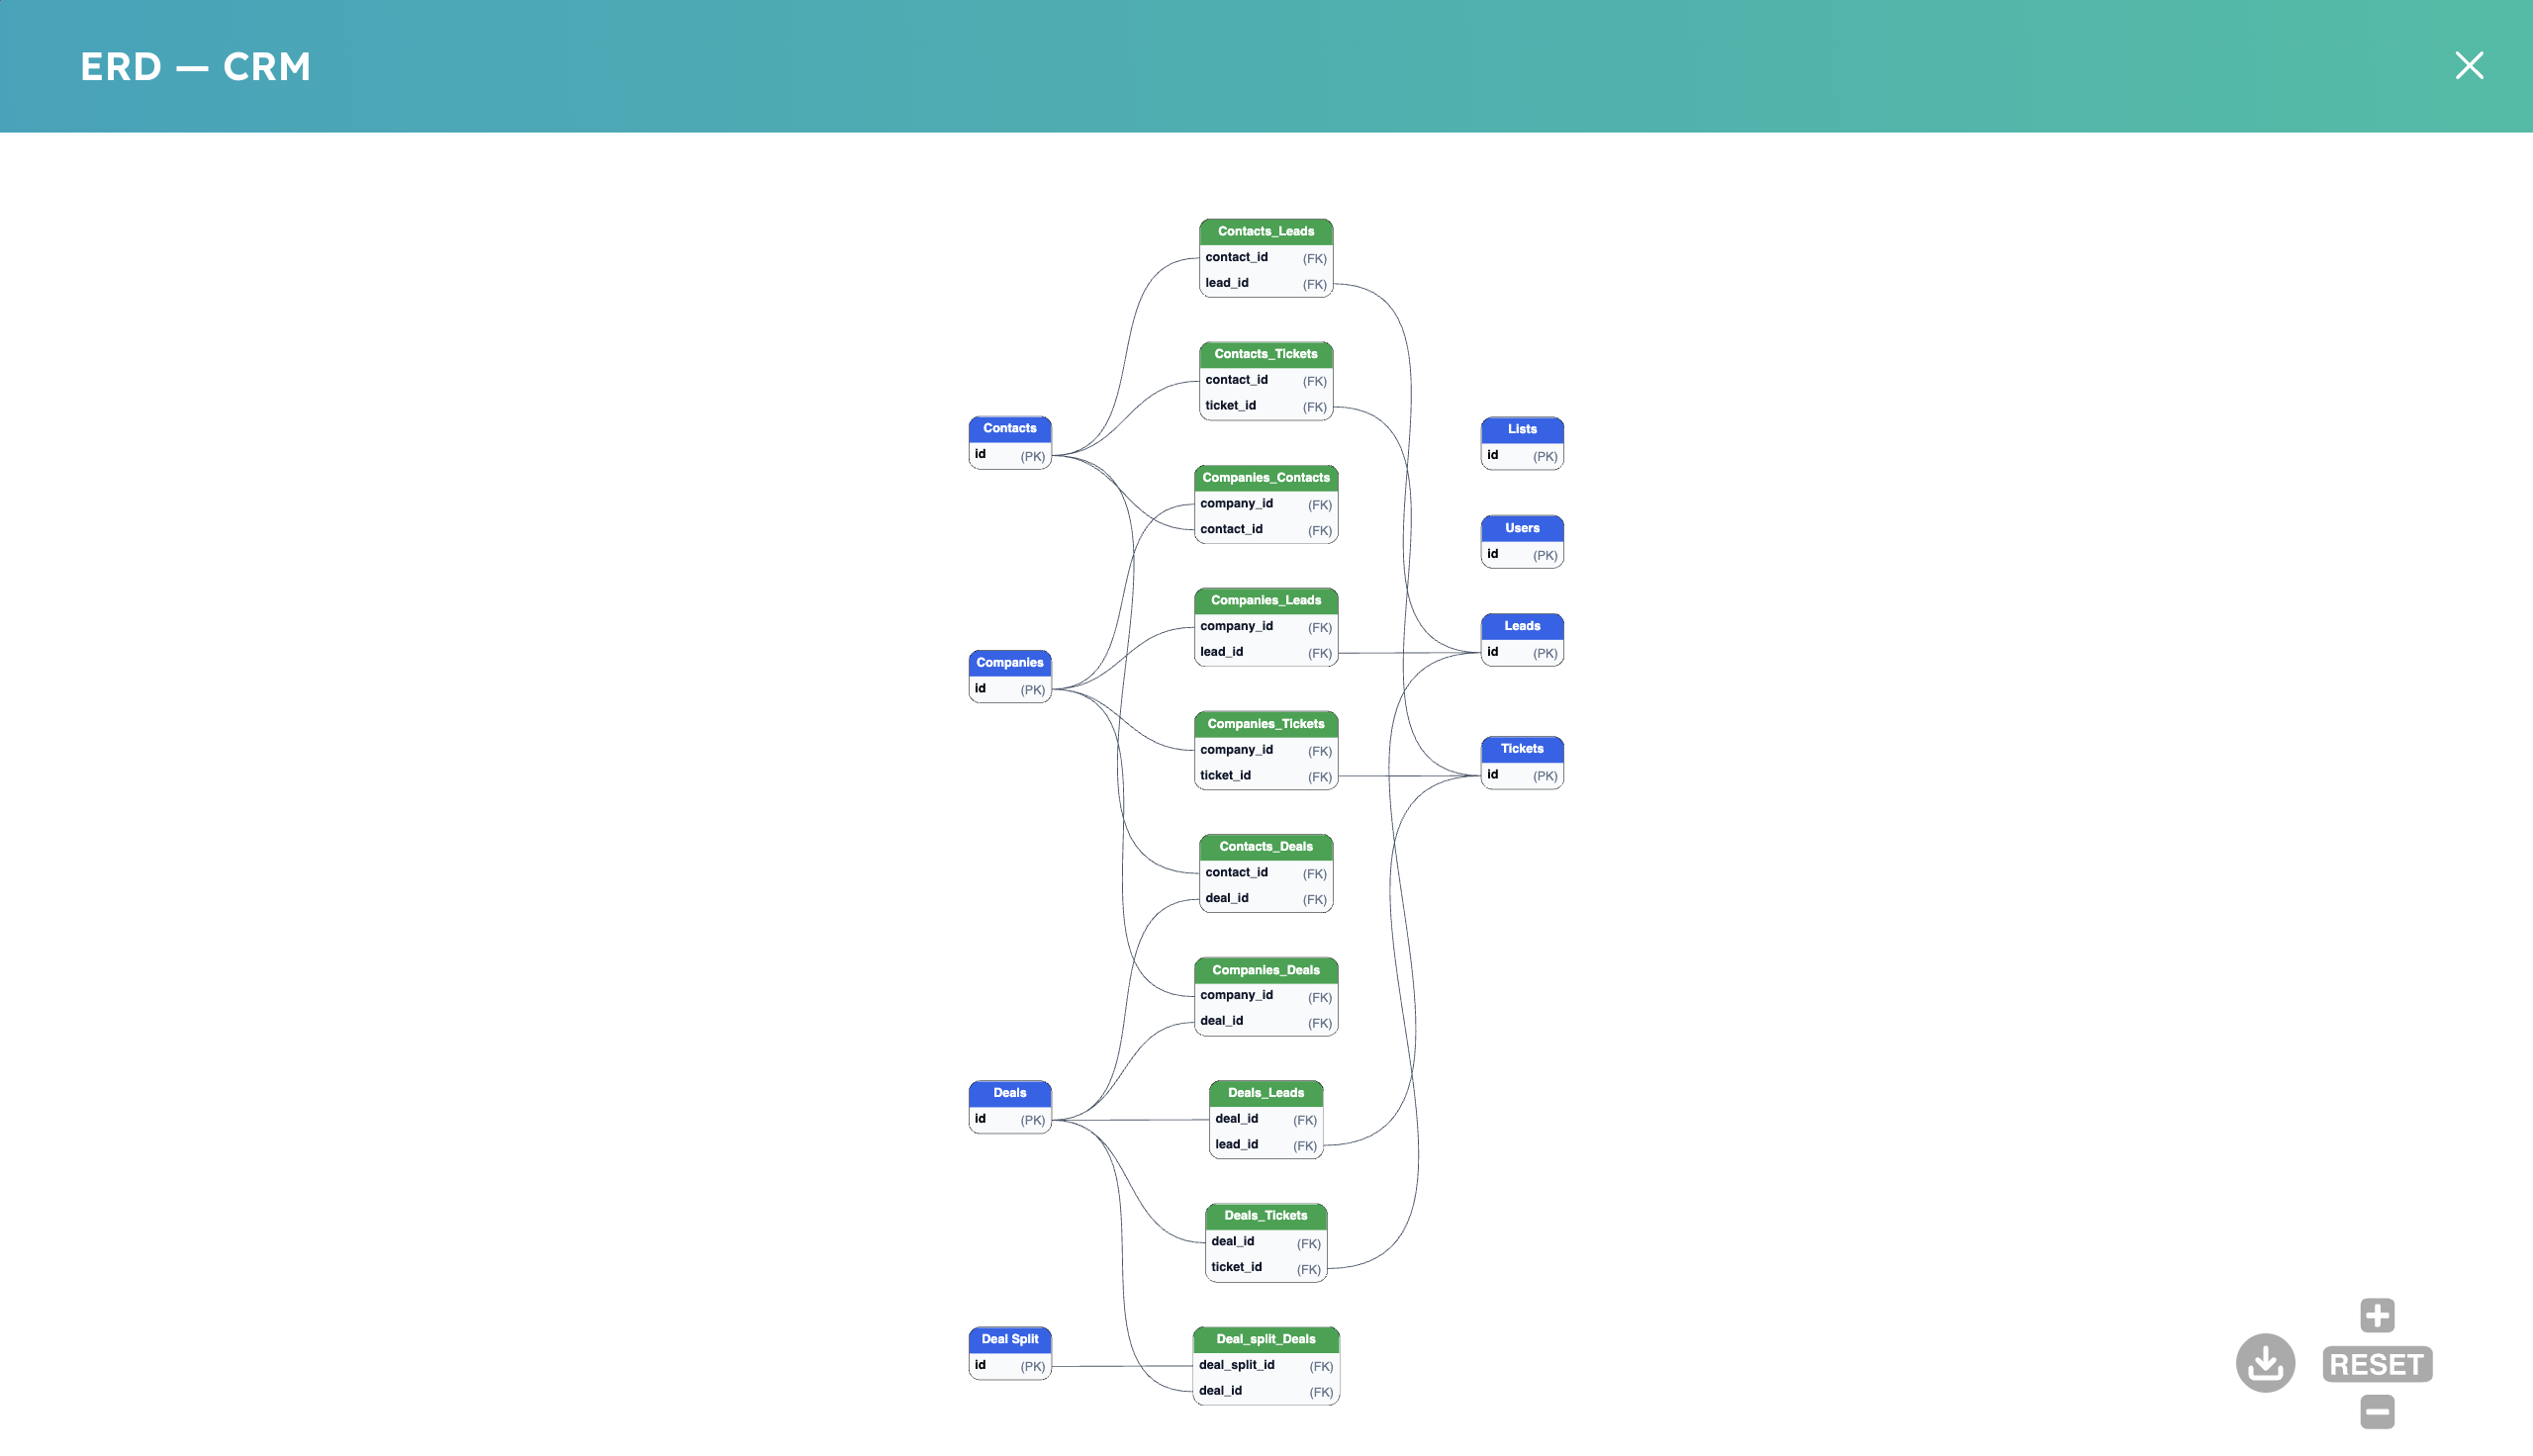
The toolbar inside the diagram exports the current view as SVG (vector, best for docs), PNG (raster, best for chat and tickets), or PDF (single-page snapshot for reviews).
Per-module ERD from Data Relationships #
Open Data Relationships in the connector’s left navigation. Pick a Category (for example CRM) and choose View diagram. The ERD shows the standard high-level schema for that module — each box is a table with its primary key, and junction tables sit between objects that have a standard HubSpot association.
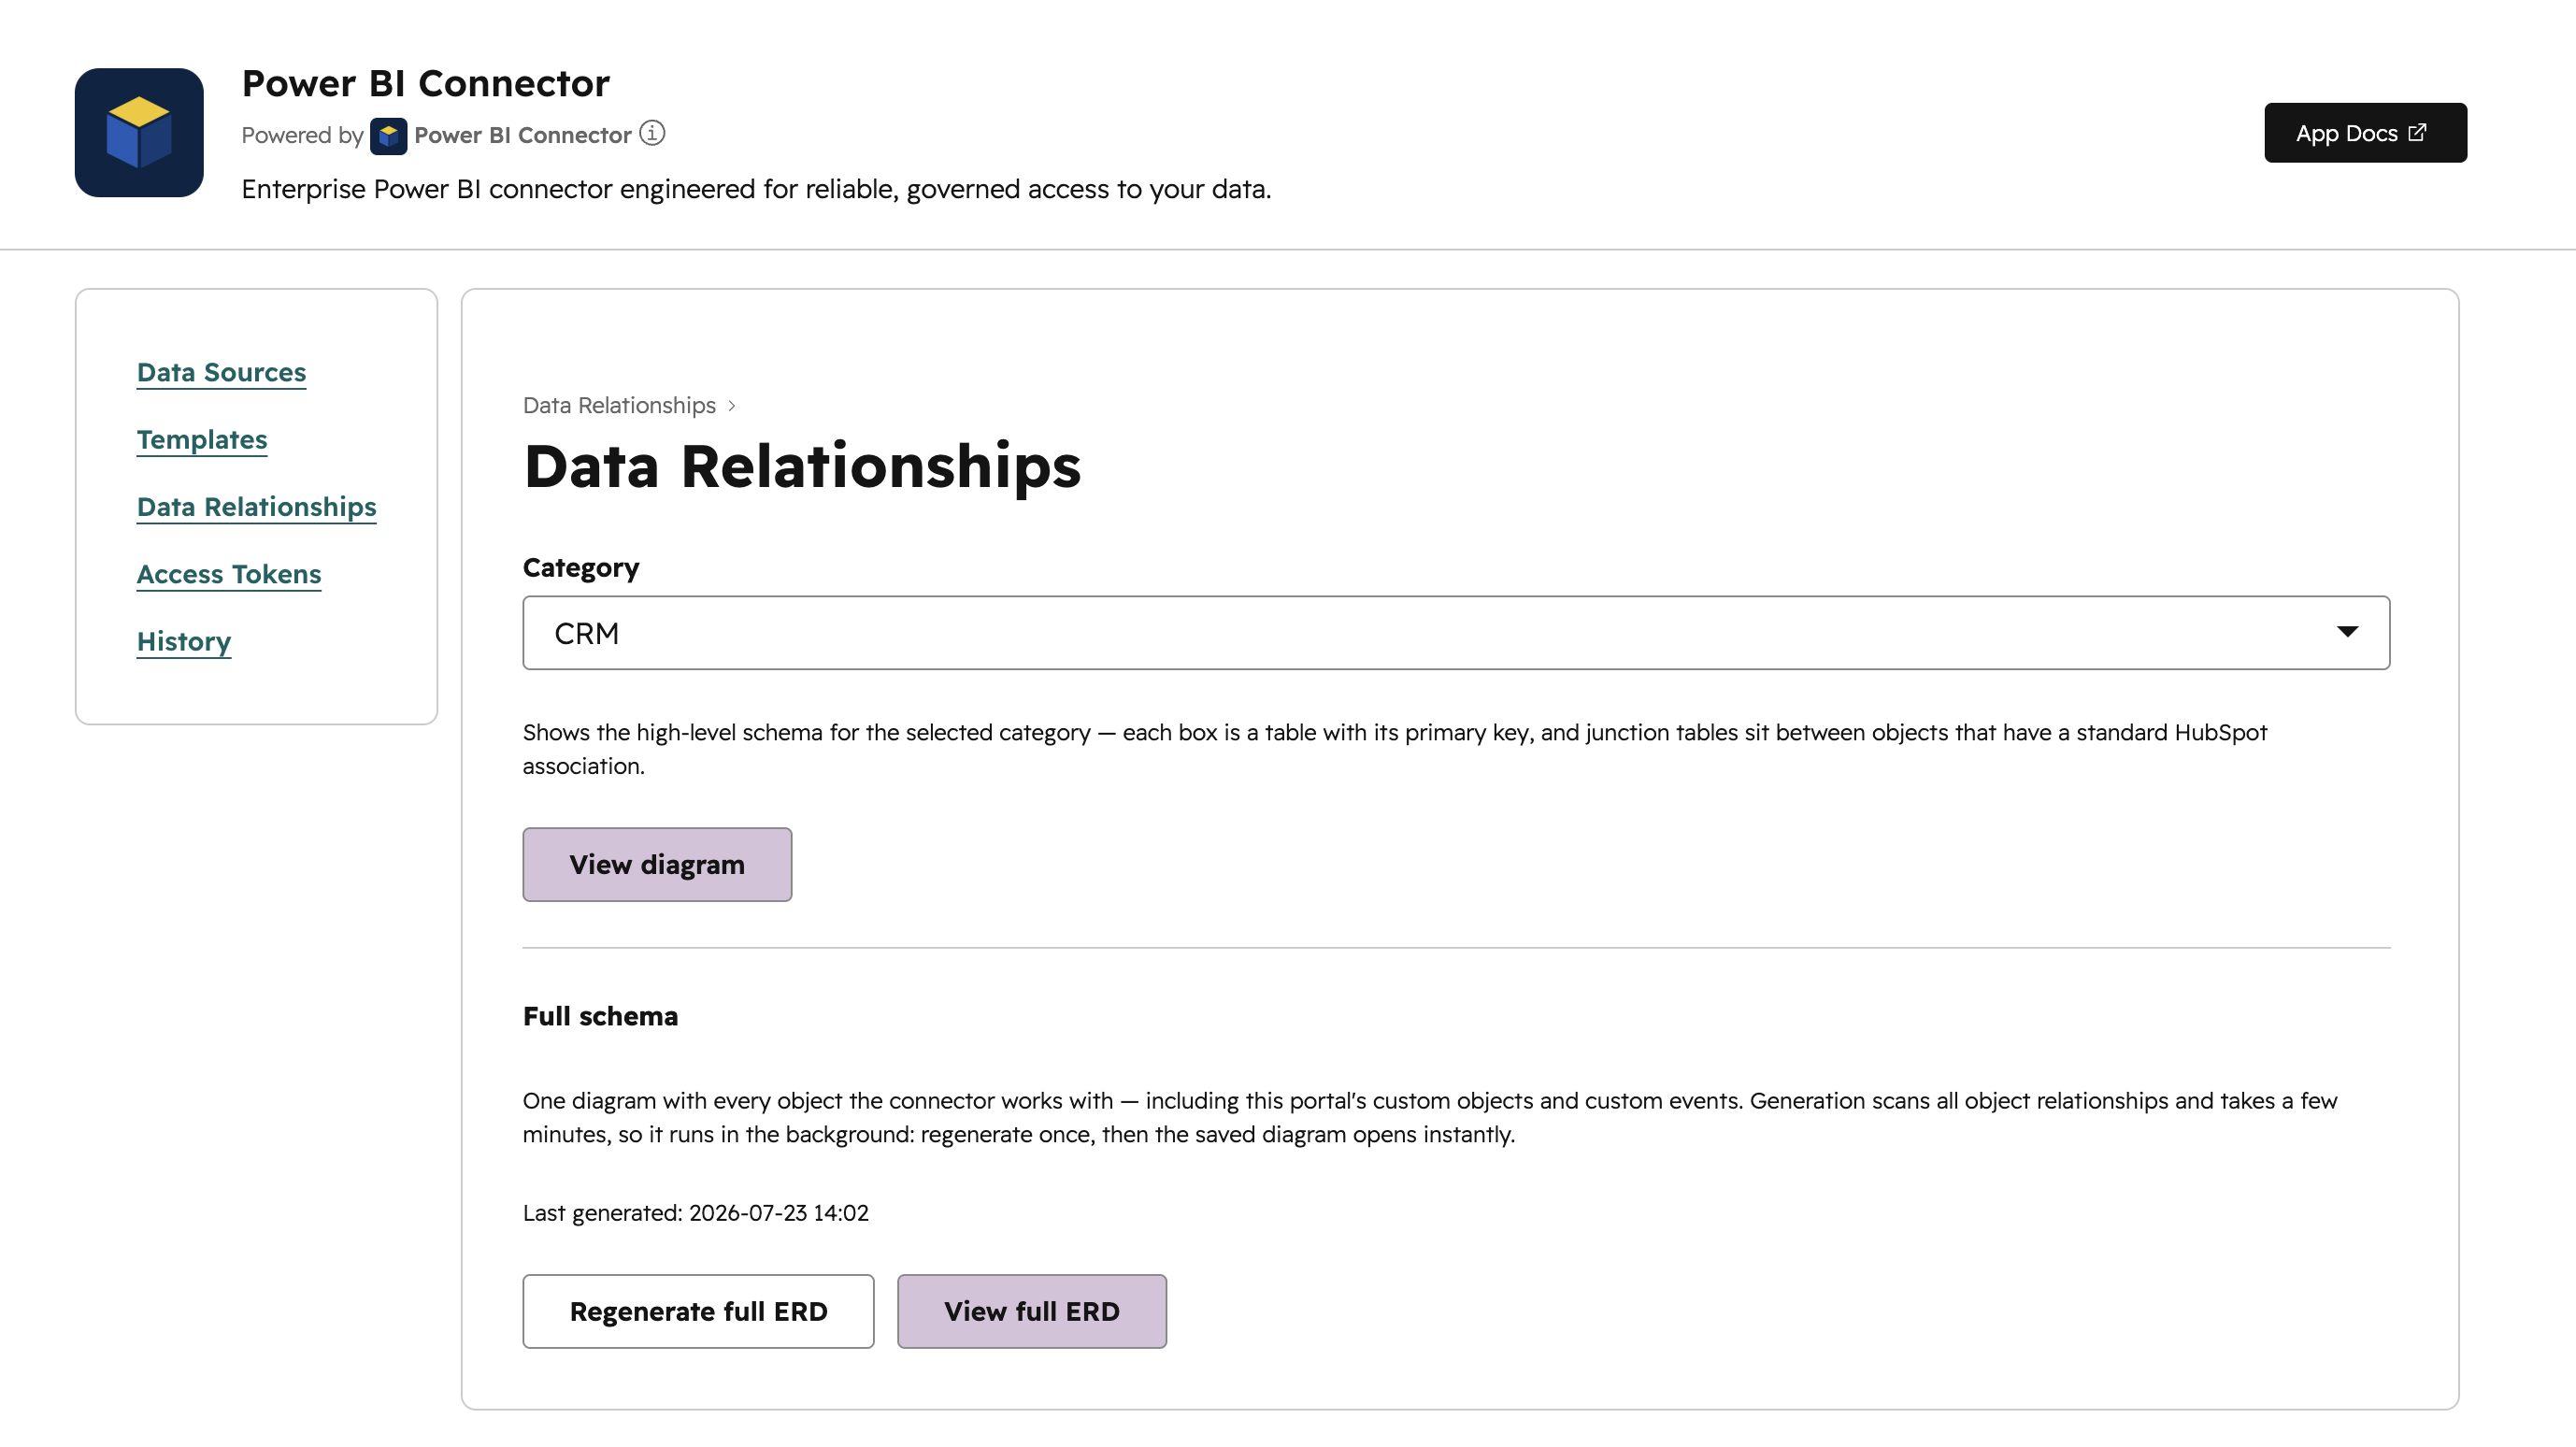
Unlike the data-source ERD, this view isn’t tied to any particular data source — it always shows the module’s full standard schema, so it’s a good middle ground when you want to understand how a whole module fits together before deciding what to put into a data source.
Full ERD (full schema) #
The full ERD renders every object the connector works with in this portal in a single diagram — standard objects, associations, junction tables, plus your portal’s custom objects and custom events. It lives on the same Data Relationships page, in the Full schema section.
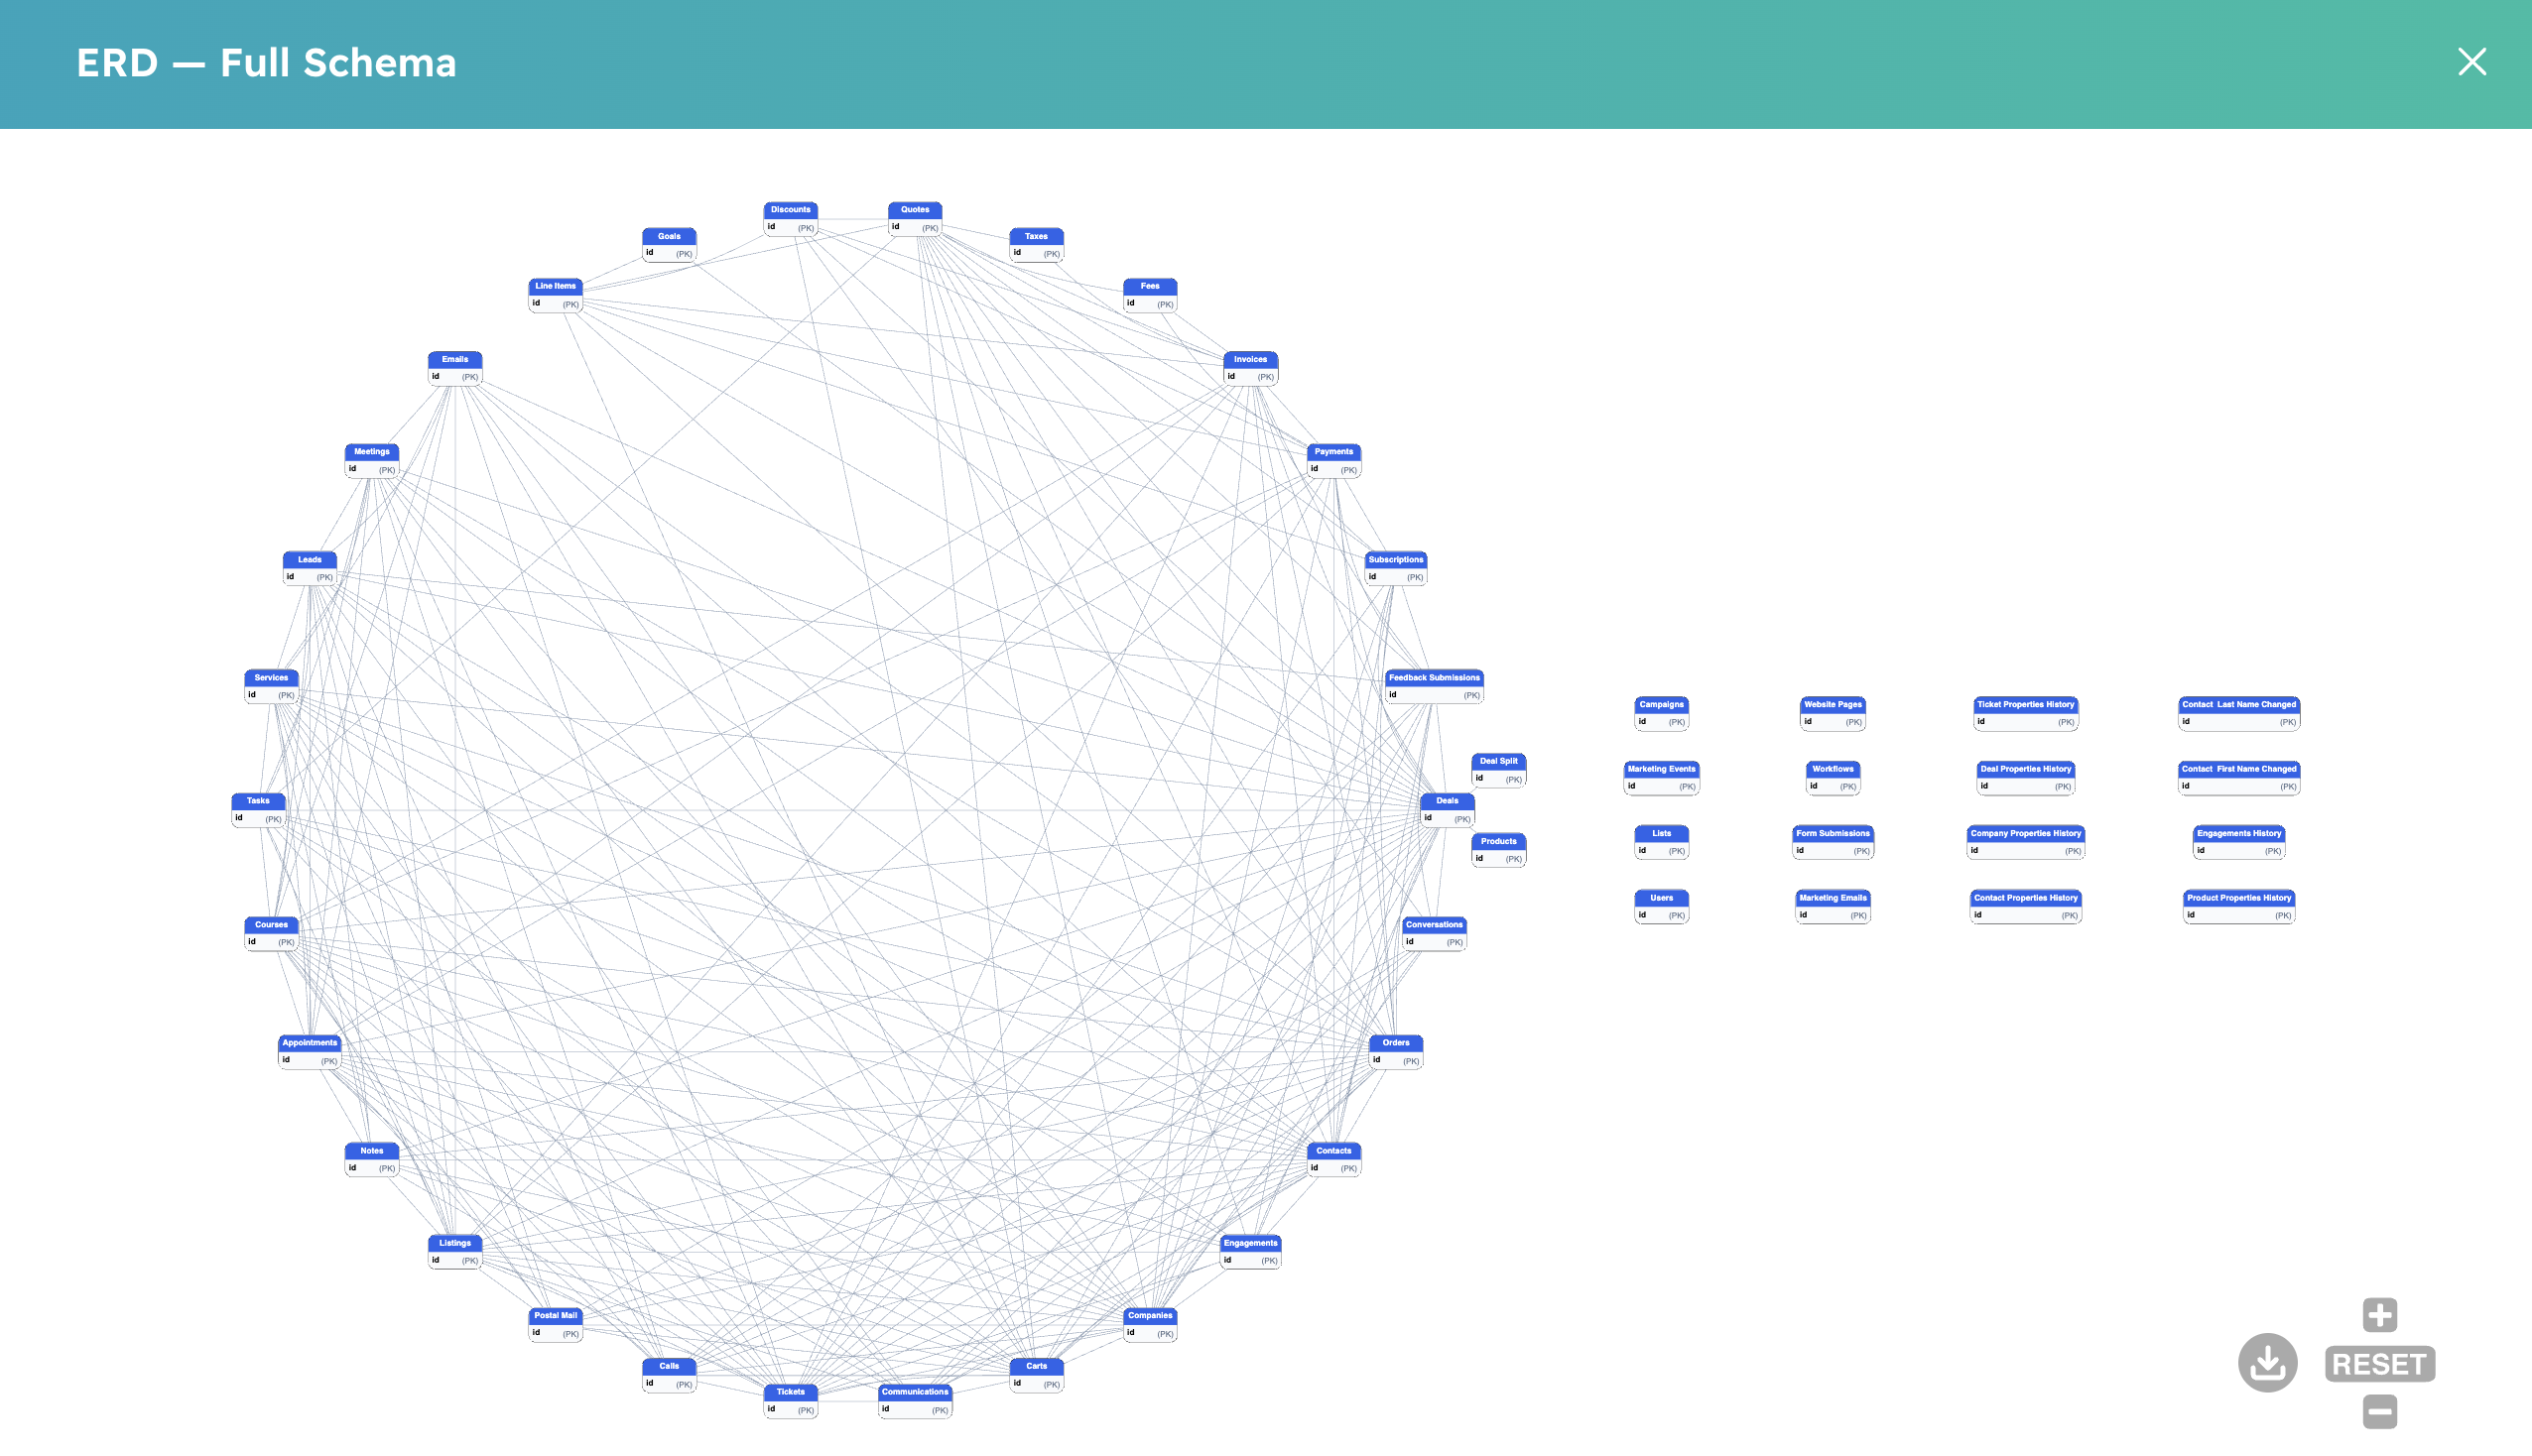
Even after generation, rendering the full ERD in the browser still takes a moment — it’s a dense diagram with a lot of nodes and edges. For most reporting use cases you’ll be faster reaching for the per-module ERD (one module at a time) or the data-source ERD (just what you selected). Open the full ERD when you genuinely need a bird’s-eye view of everything.
Which one should I use? #
- Verifying a specific data source before hooking Power BI up to it — use the data-source ERD. It reflects exactly the objects you selected, plus junction tables.
- Understanding a module’s shape (e.g. how CRM objects join to each other) — use the per-module ERD. It’s the standard schema for one HubSpot module, unfiltered by your data-source choices.
- Bird’s-eye view of everything the connector can reach in this portal, including custom objects and custom events — use the full ERD. Expect the initial generation to take a few minutes and the render itself to be dense.
Related #
- Create a Data Source — where you pick the objects that end up in the data-source ERD.
- Edit a Data Source — adjust the selection and re-preview the ERD.
- Preview Data — sample rows for the objects the ERD shows.


